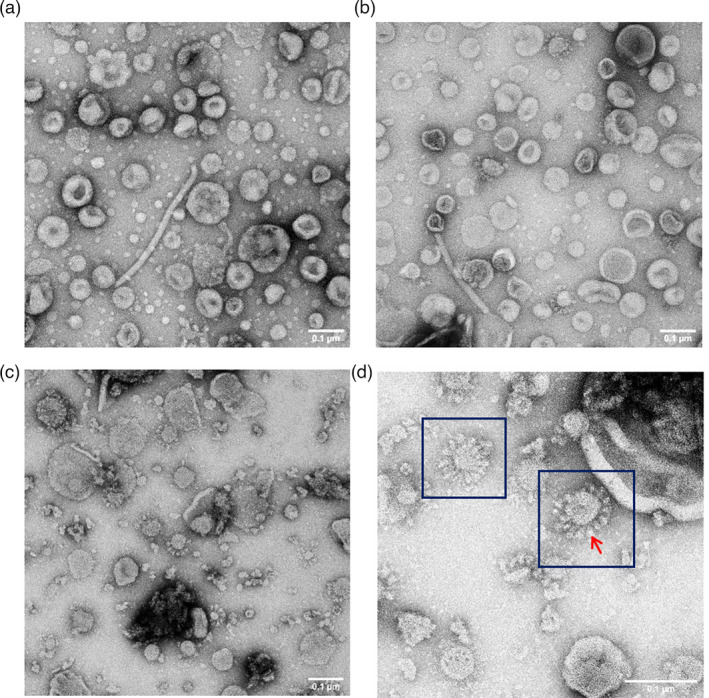
Figure 4.

Observation of SARS‐CoV‐2 VLPs using transmission electron microscopy. (a) Purified fraction #6 from EV‐infiltrated leaves prepared by the same method as EMS and S. (b) Fraction #6 from leaves infiltrated with EMS. (c) Fraction #6 from leaves infiltrated with S. (d) image of VLPs in S sample at higher magnification (150 000×), with particles showing typical coronavirus morphology surrounded by dark blue boxes and an individual spike indicated by a red arrow. All samples were stained with 2% (w/v) uranyl acetate. Scale bars represent 100 nm.
