FIGURE 1.

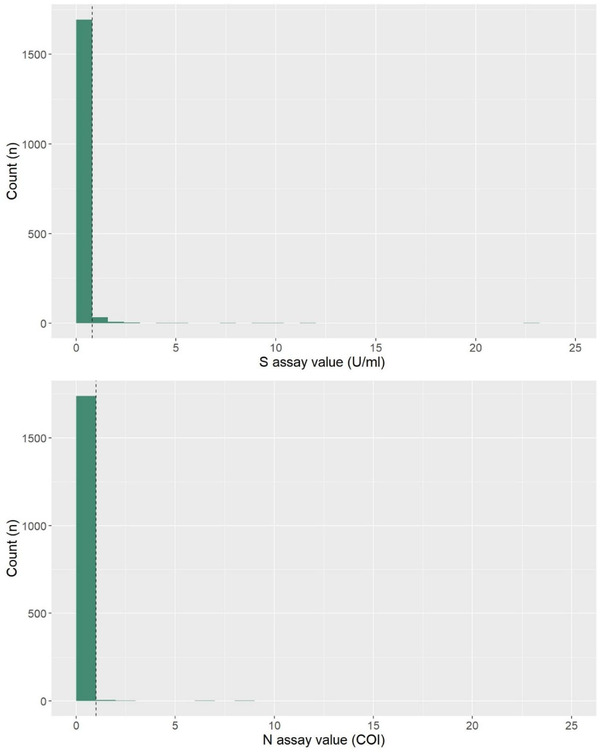
Distribution of S and N assay values; the dashed lines indicate the assay positive cut‐off values. The positive cut‐off values are >0.8 for the S assay and >1.0 for the N

Distribution of S and N assay values; the dashed lines indicate the assay positive cut‐off values. The positive cut‐off values are >0.8 for the S assay and >1.0 for the N