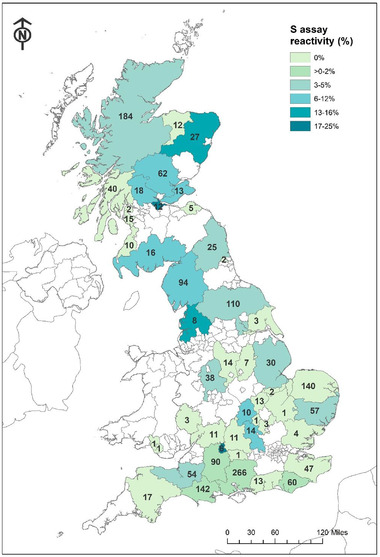
FIGURE 2.

Distribution of samples by county/Unitary Authority; the number indicating the sample size of each and colour indicating percentage of samples appearing positive on the S assay. Source: Contains Ordnance Survey data © Crown copyright and database right (2021) and National Statistics data © Crown copyright and database right (2021). © Esri, DeLorme
