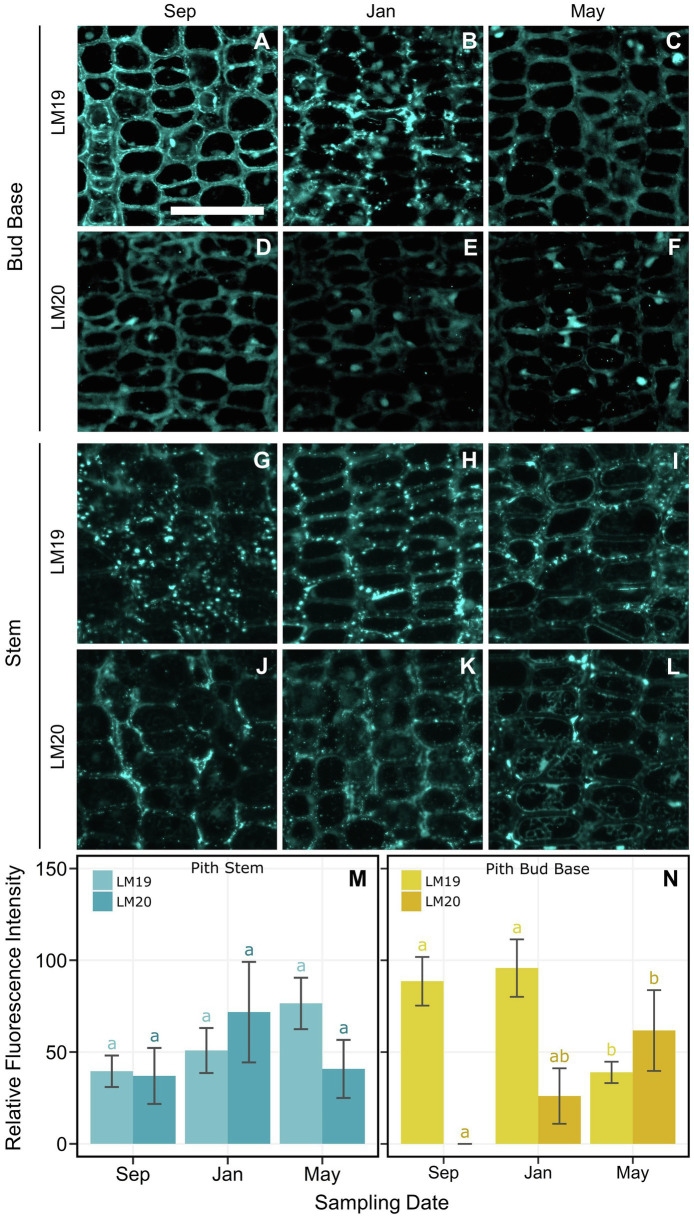
Figure 7.
Indirect immunolocalization with antibodies (A–C,G–I) LM19 (de-methyl-esterified form) and (D–F,J–L) LM20 (methyl-esterified form), targeting homogalacturonan in pith cells of Vaccinium macrocarpon. (A–L) Columns represent sampling dates, rows represent sub-grouped evaluated zone, bud base or stem by antibody LM19 and LM20. (M) Bar plot for the average relative fluorescence intensity for pith cells in the stem. (N) Bar plot for the average relative fluorescence intensity for pith cells at the bud base. Lower case letters represent significant difference among the means of the same antibody and tissue in each plot. Vertical lines represent the SE of the mean. Scale bar = 50 μm.

