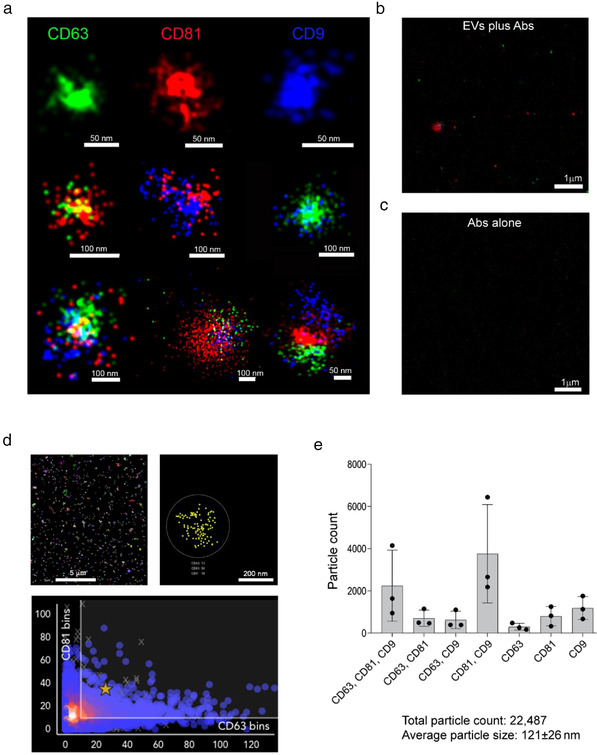
FIGURE 2.

Super‐resolution microscopy analysis of tetraspanins expression in NP‐EVs. (a) Representative super‐resolution microscopy images of NP‐EVs showing single, double, and triple expression of CD63 (green), CD81 (red), CD9 (blue). The corresponding scale bare is below each EV image. (b) Representative super‐resolution images, at low magnification, showing staining with anti‐tetraspanin antibodies in the presence of EVs (EVs plus Abs) or (c) in the absence of EVs (Abs alone). (d) Representative clustering strategy of NP‐EV analysis showing a large field of view (left panel), a selected cluster (right panel) and a graph (bottom panel) of CD81/CD63 cluster distribution. (e) Clustering analysis of super‐resolution microscopy images showing the single, double, and triple positive EV fractions expressing the tetraspanin markers. The analyses were performed in three NP‐EV preparations using a CODI software; the graph shows the mean ± SD of a cumulative analysis of 10 fields for each preparation
