
FIGURE 3.
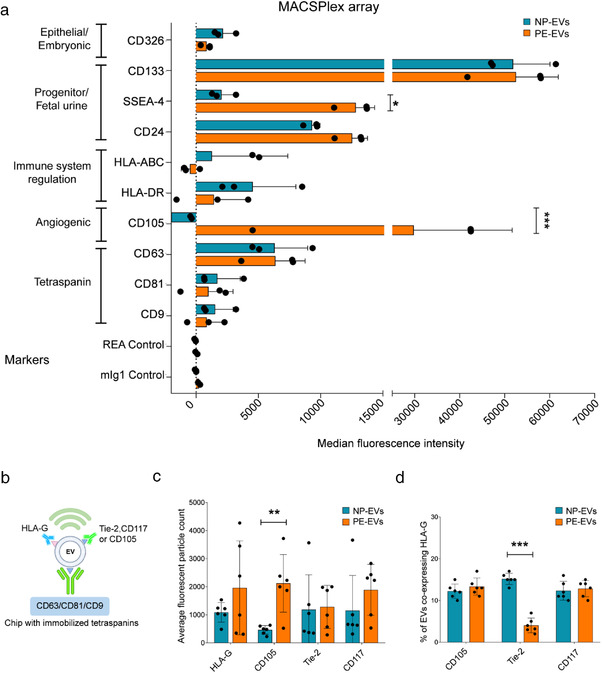
Increased CD105 expression in PE‐EVs. (a) MACSPlex analysis showing the median fluorescence intensity of surface markers characteristic of EVs (tetraspanins) or different cell of origin, expressed by NP‐ and PE‐EVs (n = 3). Expression of CD105 and SSEA‐4 was significantly increased in PE‐EVs. 5.8 × 10⁸ EVs were analysed, diluted to a final volume of 120 μl of MACSPlex buffer. (b) Diagram explaining the experimental method behind ExoView technology in relation to the graphs in panel c. (c and d) ExoView analysis of amniotic fluid‐derived NP‐EVs (n = 6) and PE‐EVs (n = 6). (c) Comparison of the expression of HLA‐G, Tie‐2, CD105 and CD117 (c‐kit) shown as average fluorescent particle count in NP‐EVs vs PE‐EVs from combined tetraspanins capture of CD63, CD81 and CD9. (d) Normalized expression of HLA‐G positive EVs co‐expressing other angiogenic (CD105 and Tie‐2) and stem cell (CD117) markers. 5.8 × 10⁸ EVs in final volume of 35 μl of buffer were used for all samples. Unpaired student's t‐test:* = P < 0.05, * * = P < 0.01, *** = P < 0.001