
FIGURE 5.
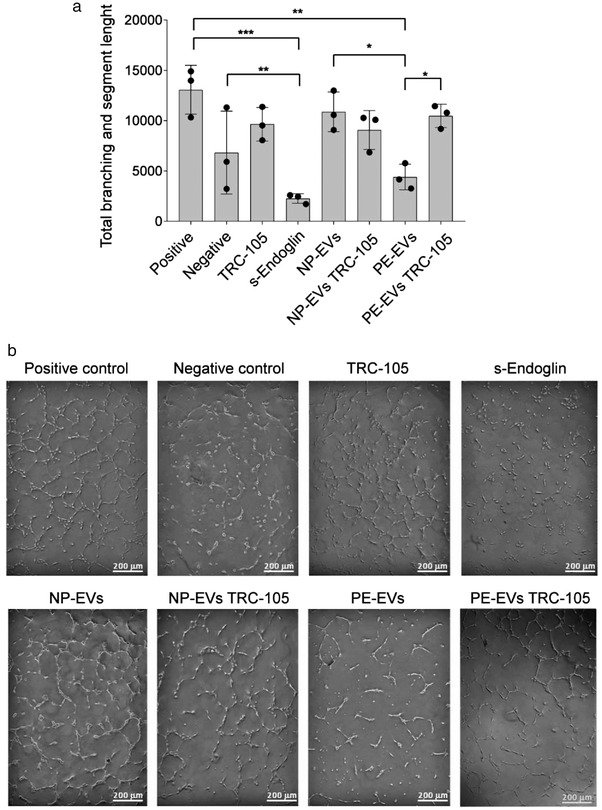
Effect of NP‐EVs and PE‐EVs on tube formation and role of CD105. (a) Quantification of tube lengths of HUVEC treated with NP‐EVs, PE‐EVs with or without anti‐CD105 Ab (TRC‐105) (8 μg/ml). A concentration of 1000 EVs/cell was used. Positive control: complete EBM medium; negative control: EBM medium without FBS. s‐Endoglin (100 ng/ml) was used as control for angiogenesis inhibition. Statistical analysis was performed using ANOVA with Bonferroni's post‐hoc test. * = P < 0.05, ** = P < 0.01, *** = P < 0.001. (b) Representative images of the tube formation assay