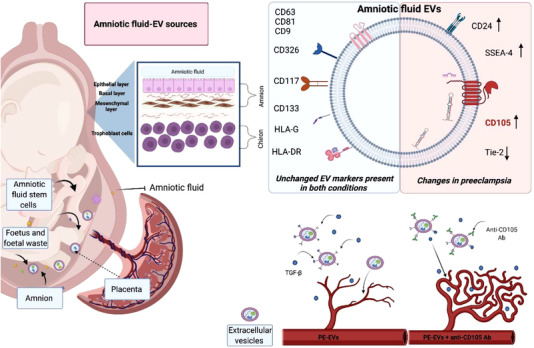
FIGURE 6.

Graphical illustration summarizing the main findings. The figure shows the multiple possible sources of term amniotic fluid‐derived EVs and the main changes in PE‐EVs. Their antiangiogenic properties are supported by the specific upregulation of CD105 surface. The image was created with https://biorender.com
