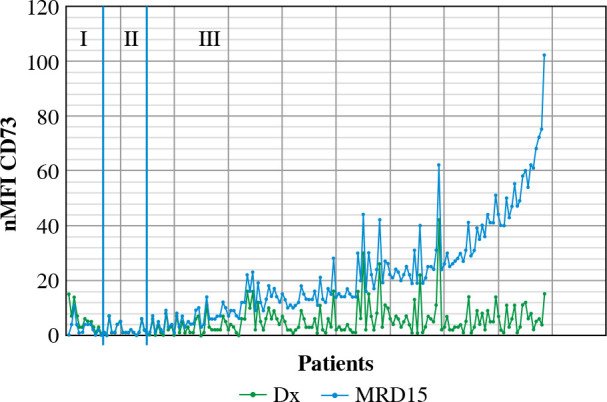
Fig. 3.

Changes in CD73 expression at day 15 of treatment. nMFI values over the green line correspond to CD73 expression at diagnosis, whereas the blue line represents the nMFI values of CD73 for corresponding patients at day 15 of treatment. The results were ordered by increasing CD73 expression, from cases with decreased expression at day 15 (section I), through constant expression at day 15 (section II), to increased expression at day 15 (section III)
