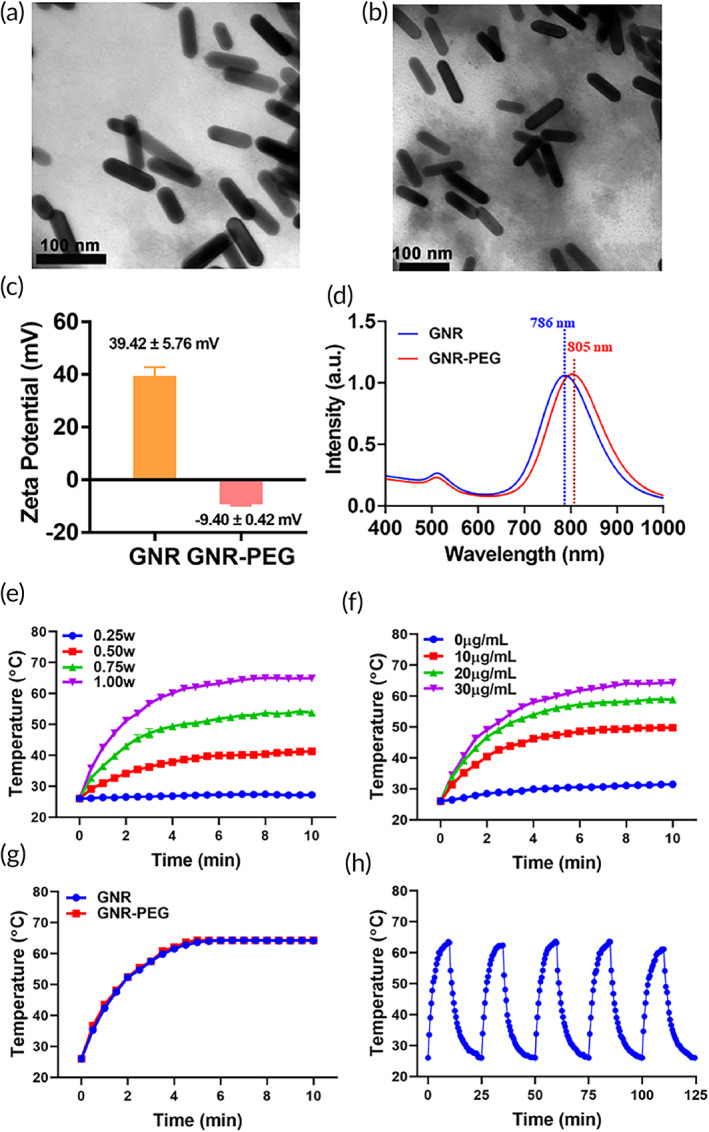
FIGURE 1.

The characterization of GNR and GNR‐PEG. TEM images of GNR (a) and GNR‐PEG (b). (c) Zeta potential of GNR and GNR‐PEG detected by Malvern Nano ZA90 (n = 3). (d) The UV‐spectroscopy of GNR and GNR‐PEG nanoparticles detected by UV–Vis–NIR. (e) The photothermal conversion curves of GNR‐PEG (30 μg/ml) with 808 nm laser irradiation at 0.25, 0.50, 0.75, 1.00 W (n = 3). (f) The photothermal conversion curves of GNR‐PEG with different concentrations after 808 nm laser irradiation at 1.00 W/cm2 (n = 3). (g) The temperature variation curves of GNR and GNR‐PEG (GNR, 30 μg/ml) with 808 nm laser irradiation at 1.00 W/cm2 (n = 3). (h) Photothermal stability of 30 μg/ml GNR‐PEG for five on and off cycles with 808 nm laser irradiation at 1.00 W/cm2. GNR, gold nanorod; TEM, transmission electron microscopy; UV, ultraviolet
