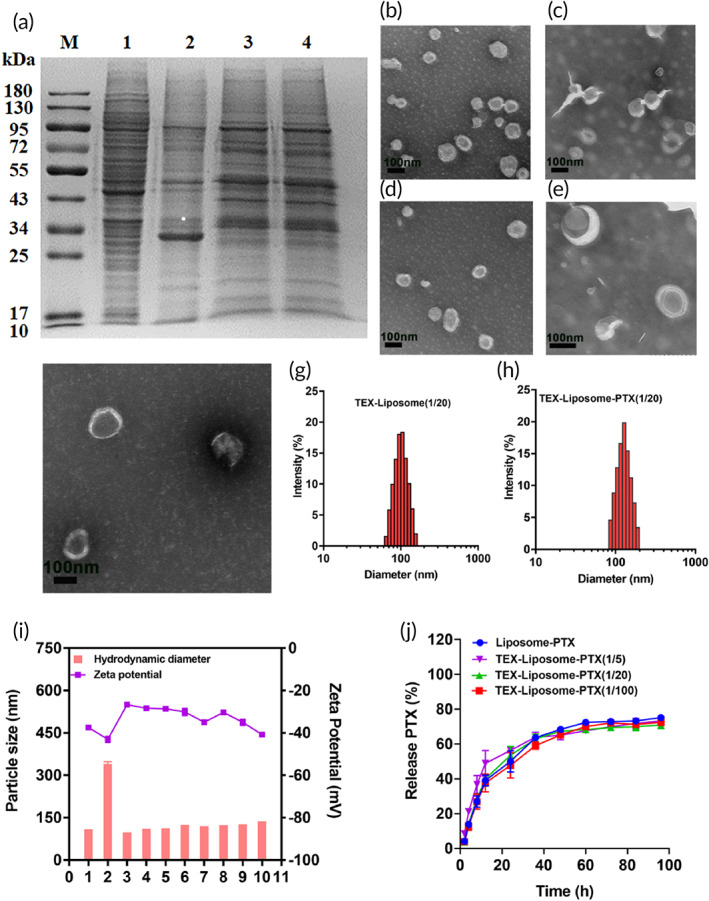
FIGURE 2.

(a) SDS‐PAGE image for protein analysis of (1) 4T1 cells, (2) TEX, (3) TEX‐membrane, and (4) TEX‐Liposome (1/20). TEM images of exosome (b), Liposome (C), Liposome‐PTX (D), TEX‐Liposome (1/20) (E), and TEX‐Liposome‐PTX (1/20) (F) with negative staining with 2% phosphotungstic acid (scale bar = 100 nm). Particle size distribution of TEX‐Liposome (1/20) (G) and TEX‐Liposome‐PTX (1/20) (H) detected by DLS. (I) The hydrodynamic diameters and zeta potentials of different nanoparticles (1, Exosome; 2, Exosome membrane; 3, Liposome; 4, TEX‐Liposome (1/100); 5, TEX‐Liposome (1/20); 6, TEX‐Liposome (1/5); 7, Liposome‐PTX; 8,TEX‐Liposome‐PTX (1/100); 9, TEX‐Liposome‐PTX (1/20); 10, TEX‐Liposome‐PTX (1/5)). (J) The in vitro release profiles of PTX in different nanoparticles (n = 3). DLS, dynamic light scattering; PTX, paclitaxel; SDS‐PAGE, sodium dodecyl sulfate–polyacrylamide gel; TEX, tumor‐derived exosome; TEM, transmission electron microscopy
