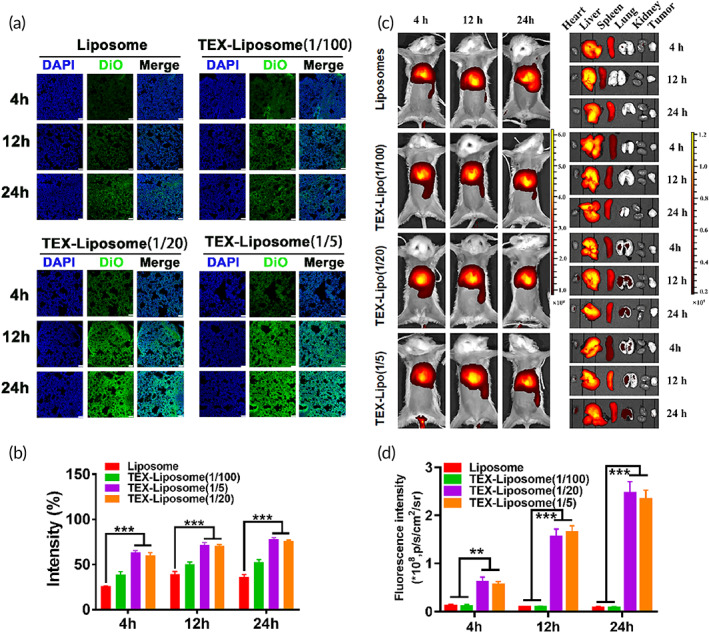
FIGURE 6.

(A) In vivo lung distribution analysis of Liposome, TEX‐Liposome‐PTX (1/5), TEX‐Liposome‐PTX (1/20), and TEX‐Liposome‐PTX (1/100) at 4, 12, and 24 h postinjection observed by CLSM (scale bar of [a] = 75 μm). (b) Quantified analysis of the DiO intensity according to (a). ***p < 0.001. (c) In vivo IVIS spectrum images and biodistribution of Liposome, TEX‐Liposome (1/5), TEX‐Liposome (1/20), and TEX‐Liposome (1/100). (d) Quantification analysis of Liposome, TEX‐Liposome (1/5), TEX‐Liposome (1/20), and TEX‐Liposome (1/100) in lung at different times according to (c). **p < 0.01, ***p < 0.001. DiO, 3,3′‐dioctadecyloxacarbocyanine perchlorate; PTX, paclitaxel; TEX, tumor‐derived exosome
