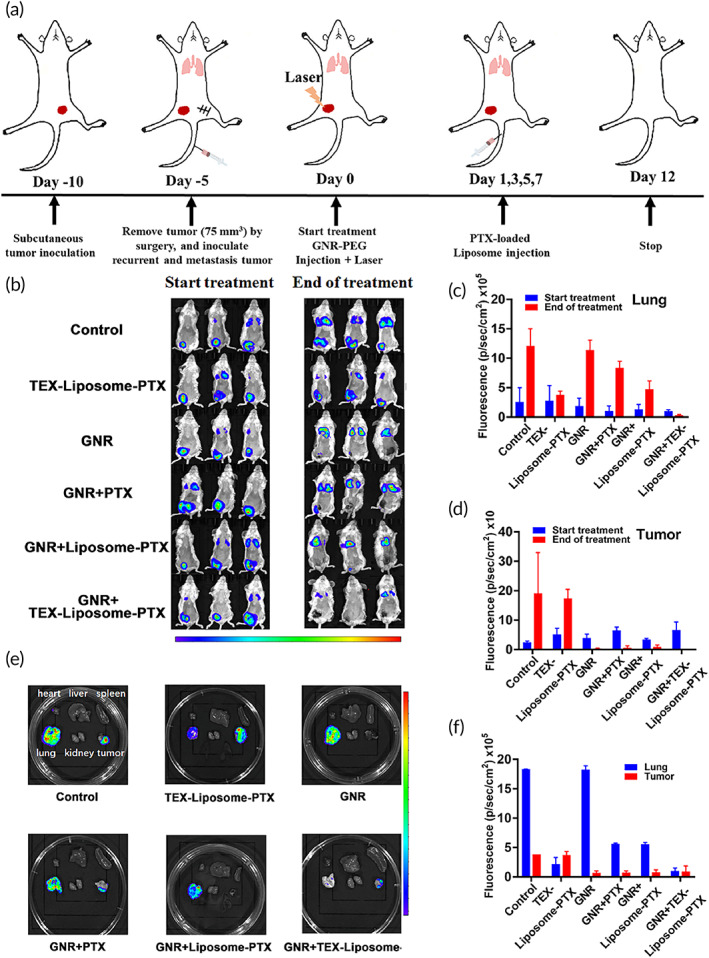
FIGURE 7.

In vivo antitumor effect investigated by bioluminescence imaging in advanced breast cancer mouse model. (a) Schematic illustrating the establish of model and the dosing process. (b) In vivo bioluminescence imaging of mice before and after treatment with different formulation groups. (c) The quantitative fluorescence intensity of lung according to (b). (d) The quantitative fluorescence intensity of tumors according to (b). (e) Bioluminescence images of ex vivo organs in different groups (lung, heart, liver, spleen, kidney, and tumor). (f) The quantitative fluorescence intensity of tumors and lung according to (e)
