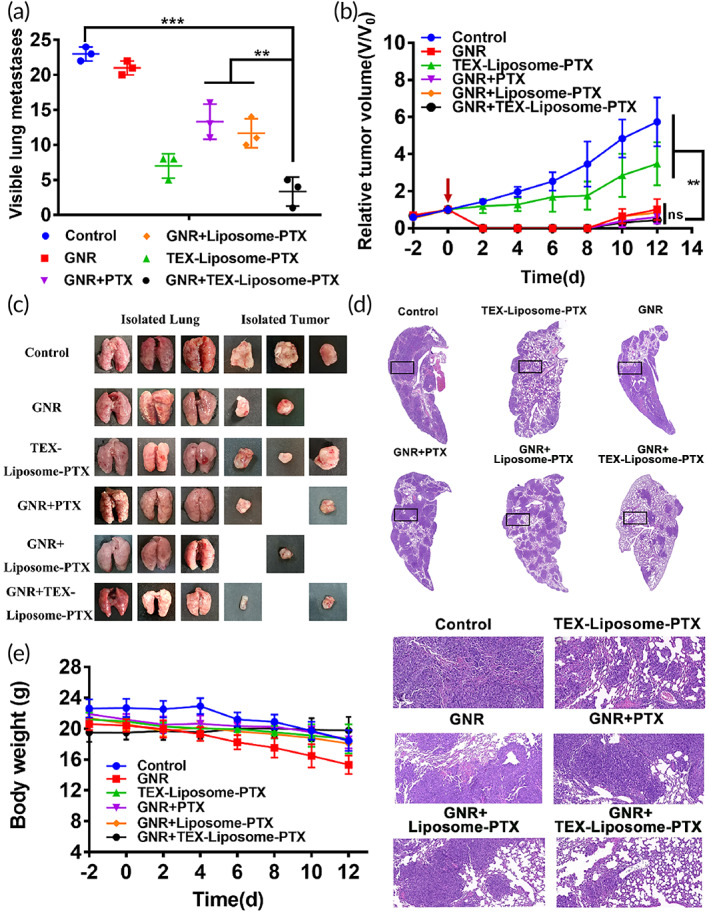
FIGURE 8.

Evaluation of in vivo therapeutic efficacy. (a) Numbers of visible metastatic nodules in each group (n = 3). (b) The relative tumor volume curves after treated with different groups (n = 3). (c) Images of lung and recurrent tumor isolated from mice treated with saline, TEX‐Liposome‐PTX, GNR, GNR + PTX, GNR + Liposome‐PTX, and GNR + TEX‐Liposome‐PTX. (d) H&E staining images of lung tissues isolated from mice after treatment. (e) Body weight changes of mice recorded every other day during the period of treatment. **p < 0.01, ***p < 0.001. GNR, gold nanorod; H&E, hematoxylin and eosin; PTX, paclitaxel; TEX, tumor‐derived exosome
