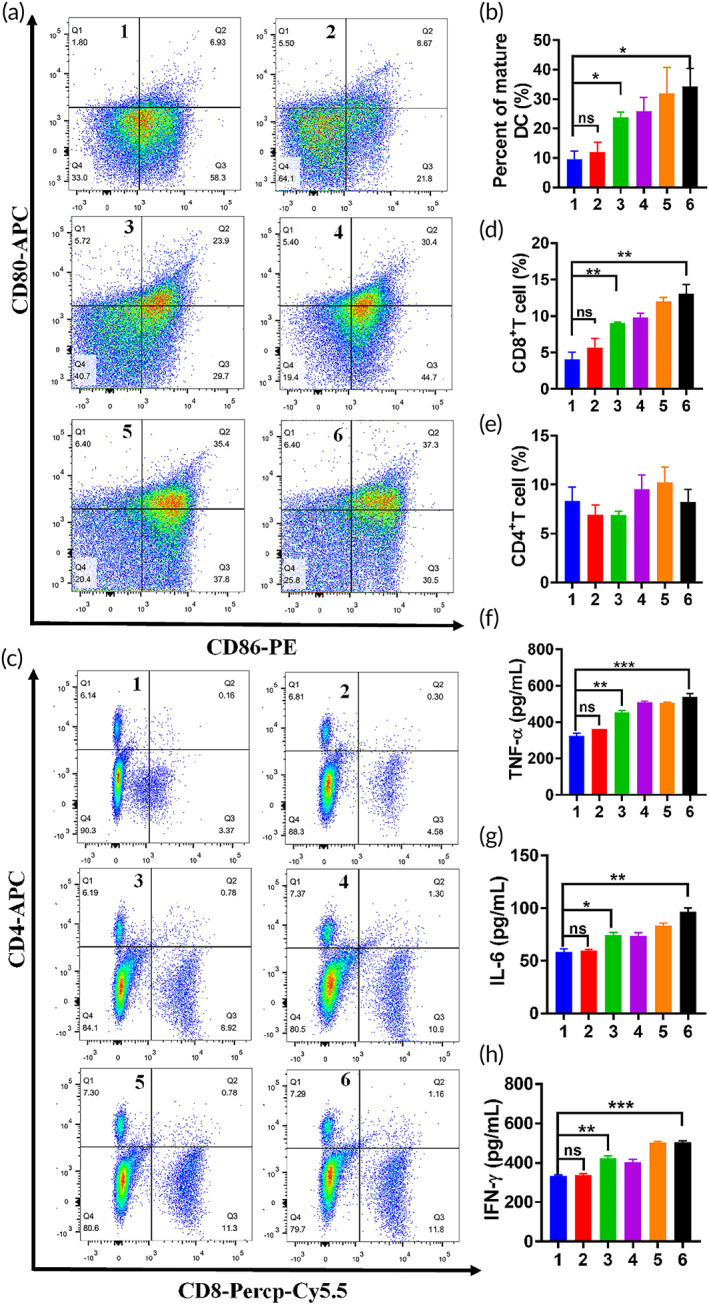
FIGURE 9.

(a) Representative flow cytometry plots of mature DC levels in inguinal lymph nodes treated with saline, TEX‐Liposome‐PTX, GNR, GNR combined PTX, GNR combined Liposome‐PTX, and GNR combined TEX‐Liposome‐PTX. (b) Quantitative analysis of DC maturation level according to (a). (c) Representative flow cytometry plots of lymphocytes differentiation levels in lung after treatment with different formulations. (d) Quantitative analysis of CD8+ T lymphocyte cells according to (b). (e) Quantitative analysis of CD4+ T lymphocyte cells according to (b). The concentration of cytokines including TNF‐α (f), IL‐6 (g), and IFN‐γ (h) in serum collected from mice (1, control; 2, TEX‐Liposome‐PTX; 3, GNR; 4, GNR + PTX; 5, GNR + Liposome‐PTX; 6, GNR + TEX‐Liposome‐PTX). *p < 0.05, **p < 0.01, ***p < 0.001. DC, dendritic cell; GNR, gold nanorod; IFN‐γ, interferon‐γ; IL‐6, interlekin‐6; PTX, paclitaxel; TEX, tumor‐derived exosome; TNF‐α, tumor necrosis factor‐α
