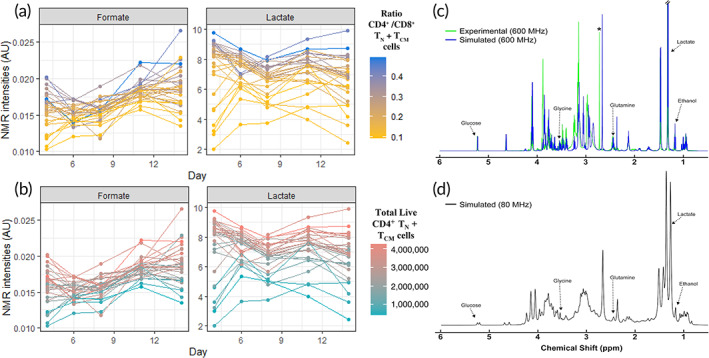
FIGURE 5.

Top‐performing features nuclear magnetic resonance (NMR) media analysis. NMR intensities in arbitrary units (AU) across time points for (a) ratio CD4+/CD8+ TN + TCM cells, and (b) total live CD4+ TN + TCM cells. (c) Simulation of 1H NMR spectrum shows the potential to detect multiple predictive features at lower magnetic fields. Overlay of a pooled experimental spectrum of T‐cell culture medium (green) and GISSMO 19 , 20 simulated spectrum (blue), composed of 19 compounds that reasonably approximate the experimental spectrum acquired at 600 MHz. Asterisk indicates an unknown feature of high intensity that was simulated with 2,3‐dimethylamine (blue feature to right). Annotated features in the spectrum correspond to those identified as being highly predictive of output responses across computational methods. (d) GISSMO 19 , 20 simulated spectrum at 80 MHz, corresponding to a field strength of commercially available benchtop NMR systems
