
FIGURE 5.
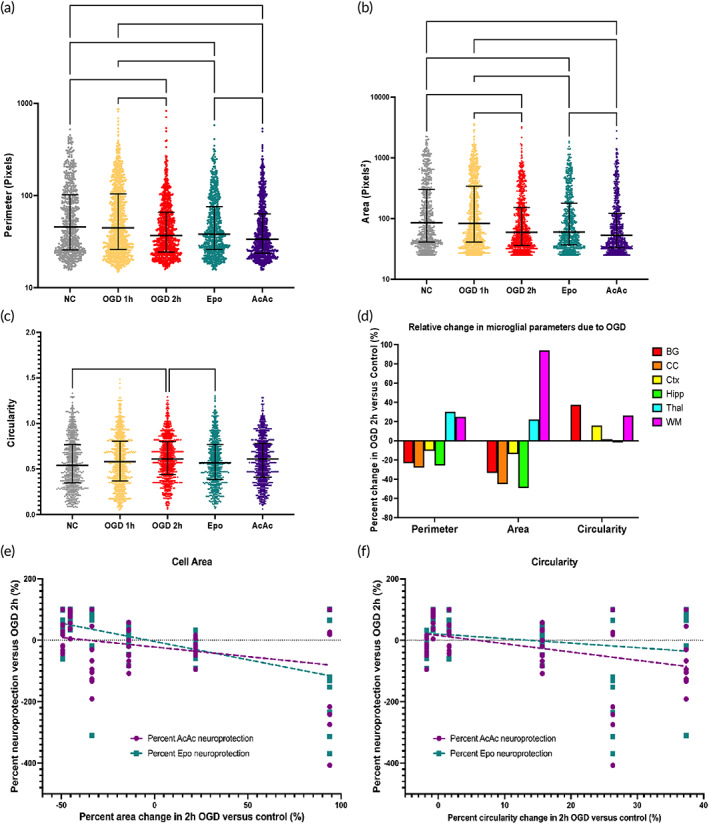
Microglial shape parameters by group and correlation between relative change in microglial morphology parameters after 2 h oxygen–glucose deprivation (OGD) and neuroprotection by Epo and AcAc. Microglial perimeter (a), area coverage (b), and circularity (c) by treatment group. Graphs display median with interquartile range. OGD 1 h did not result in any significant changes in microglial morphology. OGD 2 h resulted in an average decrease in area and perimeter, with a corresponding increase in circularity. Epo treatment significantly reduced circularity compared to OGD 2 h. Treatment with AcAc resulted in area coverage and perimeter values significantly lower than after Epo treatment. (d) Relative changes in morphology parameters in the OGD 2 h slices compared to control slices, by region. Decreases in perimeter and area coverage were seen in the basal ganglia, corpus callosum, cortex, and hippocampus, with circularity increasing in the basal ganglia and cortex. Conversely, perimeter and area coverage increased in the thalamus and subcortical white matter in OGD 2 h slices, with circularity also increasing in the white matter. Minimal changes in circularity were seen in the corpus callosum, hippocampus, and thalamus. (e) Changes in microglial area coverage in response to OGD (compared to control) were significantly correlated with degree of neuroprotection in the Epo group (R 2 = 0.29, p < 0.0001). (f) Changes in microglial circularity in response to OGD better‐predicted neuroprotection by AcAc (R 2 = 0.16, p = 0.002), with no association seen with response to Epo. *(p < 0.05), ** (p < 0.01), and *** (p < 0.001) indicate significant difference with Kruskal–Wallace test adjusted for multiple comparisons