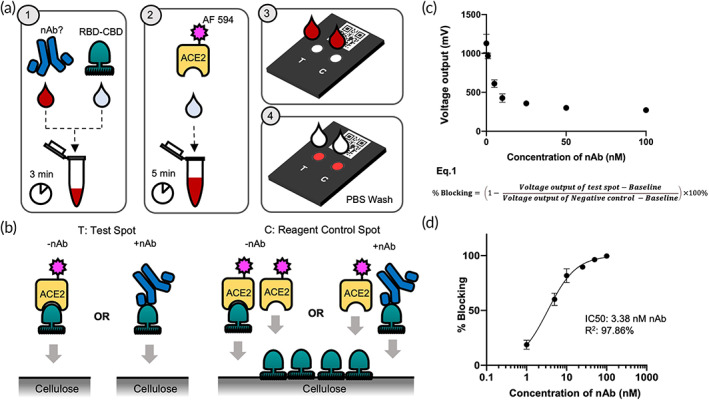
FIGURE 1.

Schematic of cpVNT workflow and results obtained with contrived whole‐blood sample. (a) Graphical representation of the modified cpVNT workflow before detection in fluorescent reader. (b) Cartoon depicting of possible molecular events occur in samples with and without nAb on the test spot and reagent control spot. (c) Measurement of fluorescence intensity from prevaccination whole blood samples titrated with 1, 5, 10, 25, 50, 100 nM SARS‐CoV‐2 monoclonal neutralizing antibody (nAb). (d) The percent blocking calculated from Equation (1) with nAb concentration presented in log scale. cpVNT, cellulose pulldown virus neutralization test; nAb, neutralizing antibody
