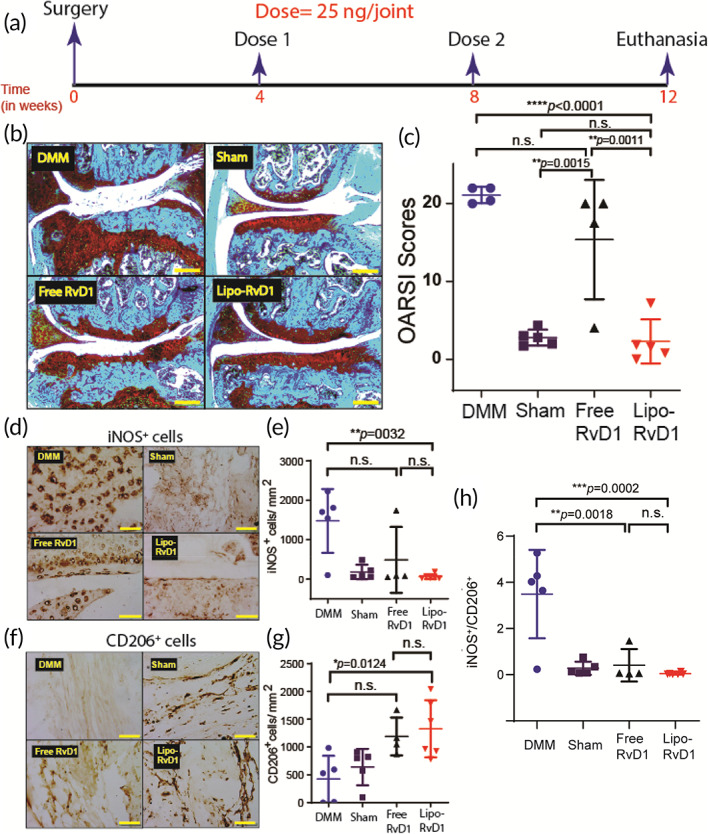
FIGURE 4.

Therapeutic administration of Lipo‐RvD1 protects cartilage from progressing damage. (a) Timeline for the study. (b) Safranin O‐stained characteristic histological images of different groups of animals (scale bar = 200 μm). (c) OARSI scores of Safranin O‐stained sections of mice joints administered with respective treatment; n = 5 sham control joints and DMM joints, n = 4 joints treated with free RvD1, and n = 6 joints treated with Lipo‐RvD1. (d) Characteristic IHC images depicting levels of iNOS+ M1 macrophages in the synovial membrane of respective mice joints (scale bar = 50 μm). (e) Quantification of iNOS+ M1 macrophages in the synovial membrane of respective mice joints; n = 4 sham control joints and joints treated with free RvD1, n = 6 DMM joints and joints treated with Lipo‐RvD1. (f) IHC images depicting levels of CD206+ M2 macrophages in synovial membrane (scale bar = 50 μm). (g) Quantification of CD206+ M2 macrophages in the synovial membrane; n = 4 sham control joints and joints treated with free RvD1, n = 5 DMM joints, and n = 6 joints treated with Lipo‐RvD1. (h) The ratio of M1/M2 cells in the synovial membranes of knee joints administered with respective injections; n = 4–6 animals per group. For c, e, g, and h, *p < 0.05, **p < 0.01, and ****p < 0.0001, between the respective groups indicated in the figures using ANOVA followed by Tukey's posthoc test. Values are expressed as mean ± SD. ANOVA, analysis of variance; DMM, destabilization of the medial meniscus; IHC, immunohistochemistry
