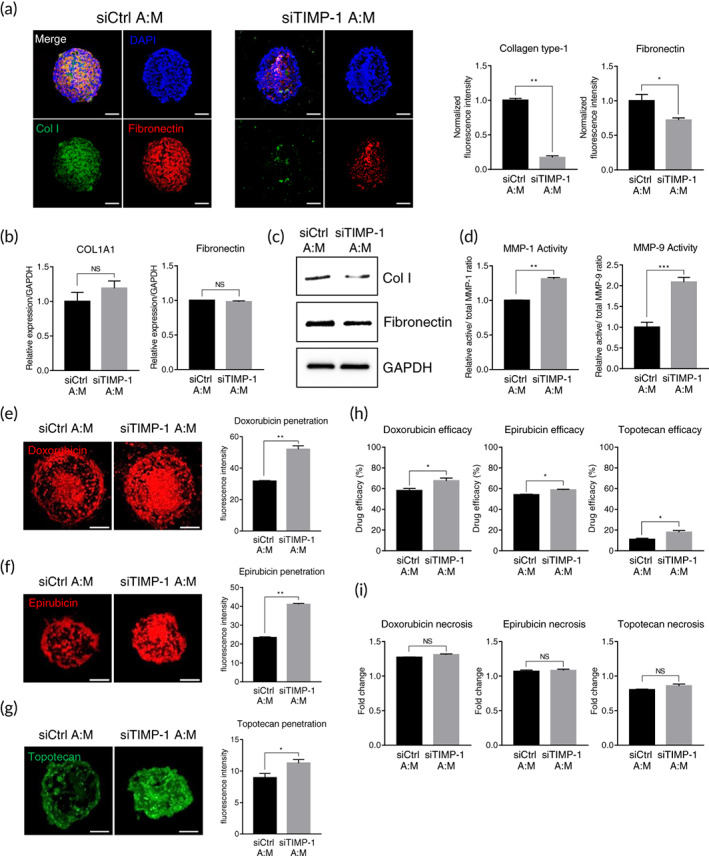
FIGURE 4.

Effects of TIMP‐1 silencing in hASC on ECM expression and drug efficacy in tumor spheroids. hASCs were transfected with TIMP‐1 or control siRNA and co‐cultured with breast cancer cells for 48 h to form tumor spheroids. (a) Collagen type‐1 (green) and fibronectin (red) staining of tumor spheroids. Scale bars, 100 μm. Quantifications of fluorescence intensity for collagen type‐1 and fibronectin were indicated in the graph. Values were normalized to the intensity of DAPI. *p < 0.05, **p < 0.01, n = 3 per group. Effect of TIMP‐1 silencing on (b) the mRNA and (c) the protein expression of ECM markers in the tumor spheroids (unpaired student's t‐test), n = 3 per group. (d) Effect of TIMP‐1 silencing on the activity of MMP‐1 and MMP‐9 in the tumor spheroids. **p < 0.01, ***p < 0.001, n = 3 per group. (e–i) The tumor spheroids generated with TIMP‐1 silenced hASCs and breast cancer cells were treated with anticancer drugs for an additional 48 h. Effect of TIMP‐1 silencing on the disposition of (e) doxorubicin, (f) epirubicin, and (g) topotecan in the tumor spheroids. Quantifications of fluorescence intensity for anticancer drugs were indicated in the graph. *p < 0.05, **p < 0.01, n = 3 per group. Scale bars, 200 μm. (h) Effect of TIMP‐1 silencing on the efficacy of anticancer drugs in the tumor spheroids. *p < 0.05, n = 3 per group. (i) Effect on the necrosis of anticancer drugs in the tumor spheroids. Necrotic cells in the tumor spheroids before drug treatment are presented as 1. NS, not significant, n = 3 per group. All data are presented as mean ± SEM, and the statistical significances were determined by unpaired student's t‐test. DAPI, 4′,6‐diamidino‐2‐phenylindole, ECM, extracellular matrix; hASCs, human adipose‐derived stromal cells; MMPs, metalloproteinases; NS, not significant; TIMP‐1, tissue inhibitor of metalloproteinases‐1; SEM, standard error of the mean
