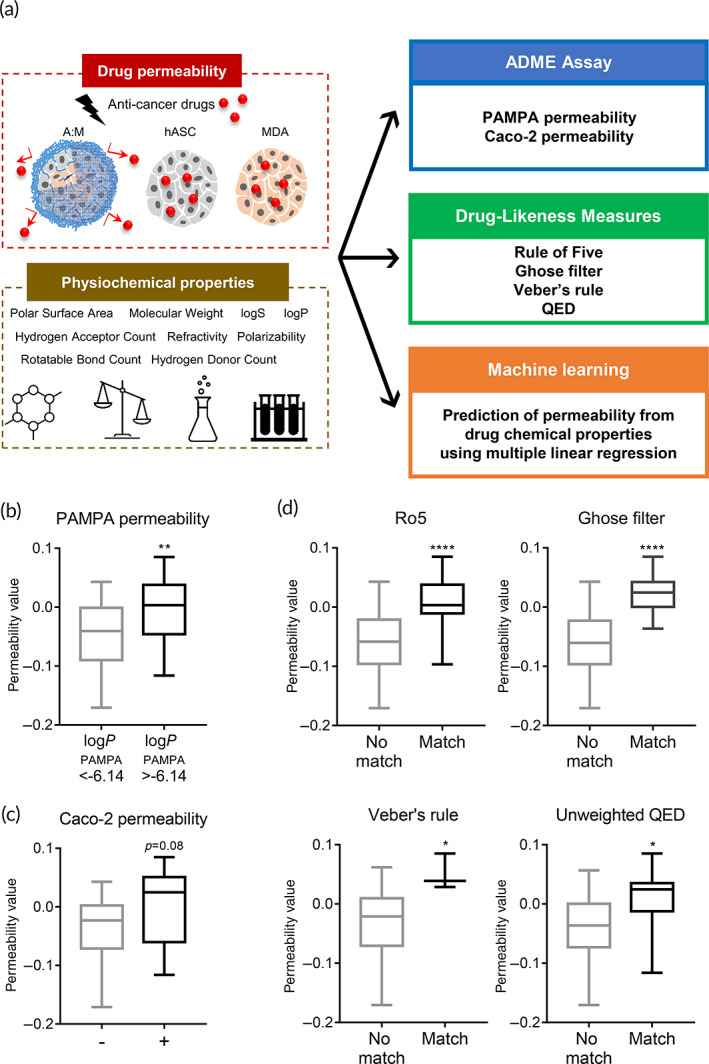
FIGURE 6.

Correlation analysis of permeability values in the tumor spheroids. (a) Schematic overview of drug screening analyses using 16 anticancer drugs. PVs were calculated with the efficacy of anticancer drugs in A:M tumor spheroids, monocellular spheroids with either hASCs or breast cancer cells as described in Equation (4). (b) Comparison of PVs of the tumor spheroids depending on (b) LogPPAMPA and (c) CaCo‐2 monolayer penetrability. **p < 0.01 (unpaired student's t‐test). Effect of (d) Ro5, (e) Ghose filter, (f) Veber's rule, and (g) unweighted QED compliance of drugs on the PVs of the tumor spheroids. *p < 0.05, ****p < 0.0001 (unpaired student's t‐test). All data are presented as mean ± SEM. PVs of 16 drugs are listed in Table S2. hASCs, human adipose‐derived stromal cells; ADME, absorption, distribution, metabolism and elimination; PVs, permeability values; QED, quantitative estimate of drug‐likeness; SEM, standard error of the mean
