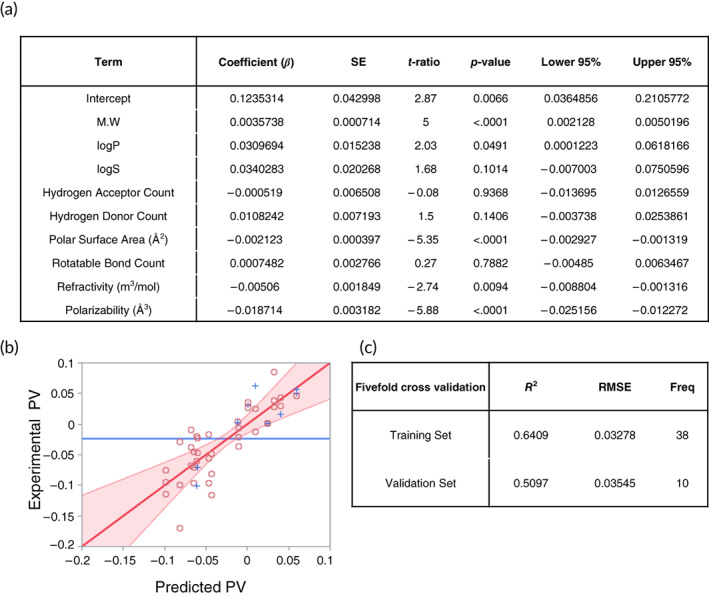
FIGURE 7.

QSAR analysis for predicting drug permeability. (a) Chemical properties and its coefficients affecting PVs in the tumor spheroids derived from MLR. (b) Scatter plot obtained from the comparison of experimental PVs and predicted PVs in the training set. Circles and crosses indicate training and validation data set, respectively. Red area represented the values with p < 0.05. (c) Coefficient of determination and RMSE values in the training and validation set from cross‐validation. Variants of 16 drugs derived from MLR are presented in Table S3. MLR, multiple linear regression; PVs, permeability values; QSAR, quantitative structure–activity relationship
