FIGURE 3.

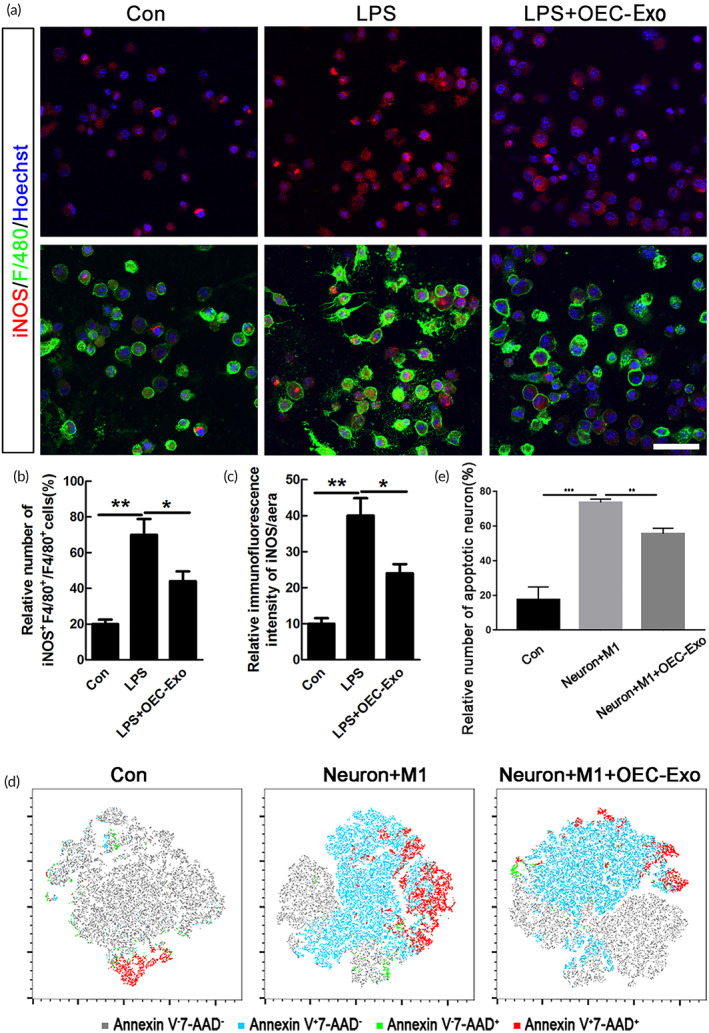
OECs‐Exo inhibited LPS‐induced pro‐inflammatory polarization of microglia. (a) Representative images of staining of iNOS and F4/80 in microglia under normal condition, LPS or LPS plus OECs‐Exo treatment. Scale bar = 30 μm. (b,c) Quantification of the numbers of iNOS‐positive cells and the IFI/area of iNOS. Note that OECs‐Exo significantly inhibited the increased number of iNOS‐positive cells and IFI of iNOS induced by LPS. N = 3, *p < 0.05, **p < 0.01. IFI, immunofluorescence intensity. (d) Neurons were stained with PE Annexin V and 7‐AAD in blank, co‐culture with M1 microglia, M1 microglia treated with OEC‐Exo respectively. The representative plots from flow cytometry were shown as the indicated by the T‐distributed random neighbor embedding (tSNE) format. The gray, blue, green, and red dots denoted Annexin V‐7‐AAD‐, Annexin V + 7‐AAD‐, Annexin V‐7‐AAD+, Annexin V + 7‐AAD+ subsets respectively. (e) Quantification of the relative number of apoptotic neurons (Annexin V +). N = 3, ***p < 0.001, **p < 0.01
