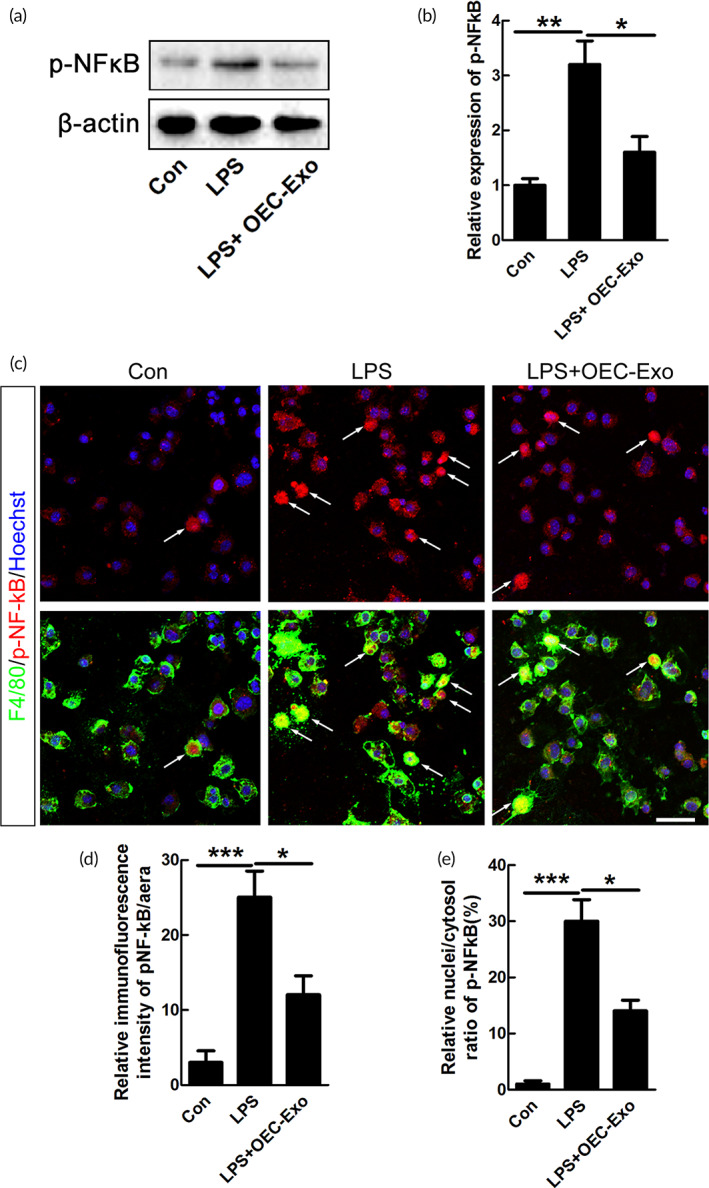
FIGURE 4.

Effects of OECs‐Exo on expression of pNF‐κB after LPS treatment. (a) Expression of pNF‐κB in microglia under control, LPS or LPS plus OECs‐Exo treatment. (b) Quantification of expression level of pNF‐κB normalized to β‐actin. N = 3, *p < 0.05, **p < 0.01. (c) Immunostaining of pNF‐κB and F4/80. Scale bar = 30 μm. (d,e) Quantification of the IFI/area and the nuclei/cytosol fluorescence intensity ratio of pNF‐κB. Note that OECs‐Exo significantly suppressed the increased IFI and nuclear translocation of pNF‐κB induced by LPS. N = 3, *p < 0.05, ***p < 0.001
