FIGURE 5.

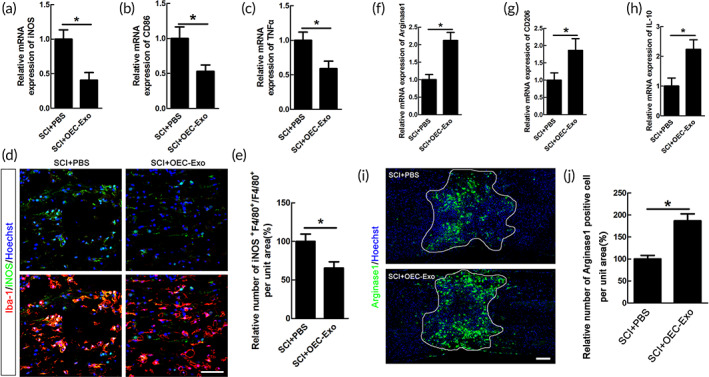
Efferocytosis of OECs‐Exo by microglia/macrophages alleviated their pro‐inflammatory polarization and increased the anti‐inflammatory cells after SCI. Quantification of pro‐inflammatory mRNA of iNOS (a), CD86 (b), and TNFα (c) in PBS or OECs‐Exo‐treated rats at 14 dpi. N = 6/group, *p < 0.05. (d) Representative images of staining of iNOS and Iba‐1 in PBS or OECs‐Exo‐treated rats at 14 dpi. Scale bar = 50 μm. (e) Quantification of iNOS‐positive microglia/macrophages in the bilateral areas 2000 μm rostral and caudal to the lesion site. Notice that OECs‐Exo treatment decreased the numbers of iNOS‐positive microglia/macrophages. N = 6/group, *p < 0.05. Expression of M2‐associated mRNA transcripts of Arginase1 (f), CD206 (g), IL‐10 (h) in PBS or OECs‐Exo ‐treated rats at 14dpi. N = 6, *p < 0.05 versus SCI+ PBS control. (i,j) Immunohistochemistry Arginase1‐positive cells in PBS or OECs‐Exo‐treated rats at 14 dpi and quantification of staining. Lesion border defined by GFAP immunoreactivity. N = 6/group, *p < 0.05 versus SCI+ saline control. Scale bar = 300 μm
