FIGURE 6.

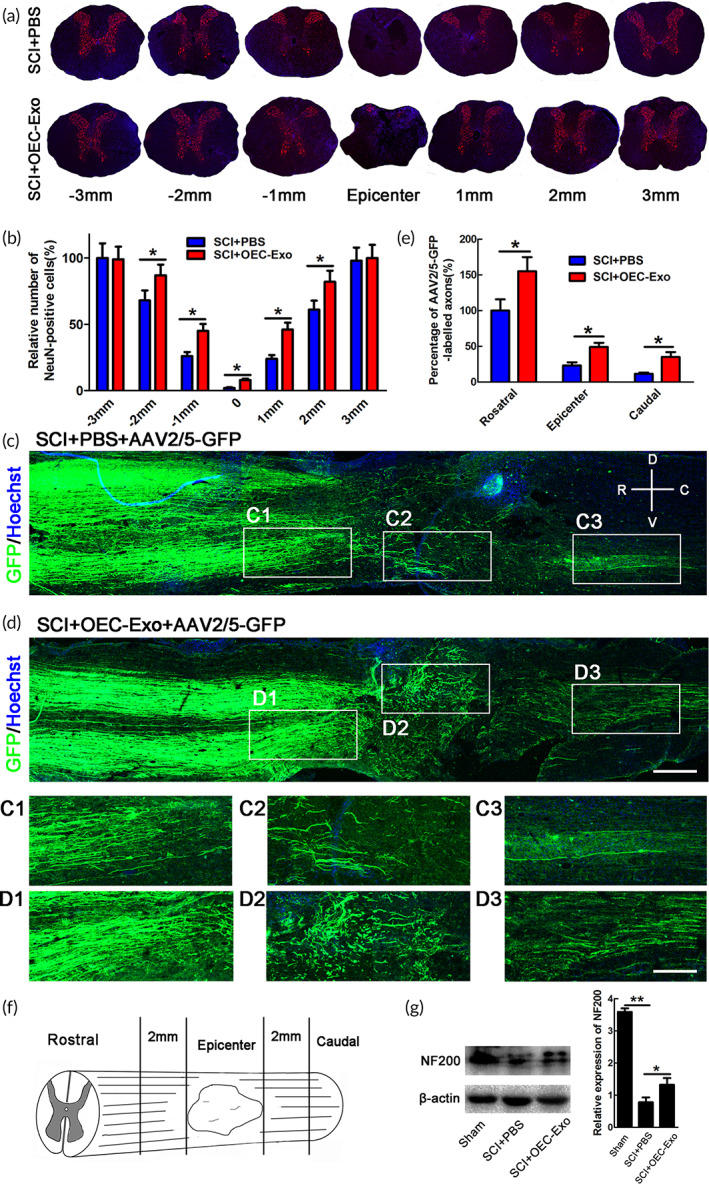
The effect of OECs‐Exo treatment on neuronal survival and preservation of axons after SCI. (a) Representative images of NeuN‐immunostaining in transverse sections in PBS‐ or OECs‐Exo‐treated rats at 4 wpi. The area of 3000, 2000, 1000 μm rostral and caudal to the lesion, as well as epicenter was selected to analyze. Scale bar = 300 μm. (b) Quantification of NeuN‐positive cells. Note that OECs‐Exo treatment significantly increased the numbers of NeuN‐stained neurons. N = 6/group, *p < 0.05. (c,d) Representative images of AAV2/5‐GFP‐labeled axons in longitudinal sections at 4 wpi in different groups. The high magnification images (C1–C3, D1–D3) were from the low magnification images in epicenter, rostral, and caudal areas of 2000 μm adjacent to lesion. Scale bar = 800 μm in low magnification images and 300 μm in high magnification images. Note that there are some axons present at caudal to the epicenter, demonstrating that our SCI model was incomplete. (e) Quantification of AAV2/5‐GFP‐labeled axons. N = 6/group, *p < 0.05. (f) The area on which quantification was performed. (g) Expression and quantification of NF200 in sham, SCI + PBS, or SCI + OECs‐Exo treatment. N = 3, *p < 0.05, **p < 0.01
