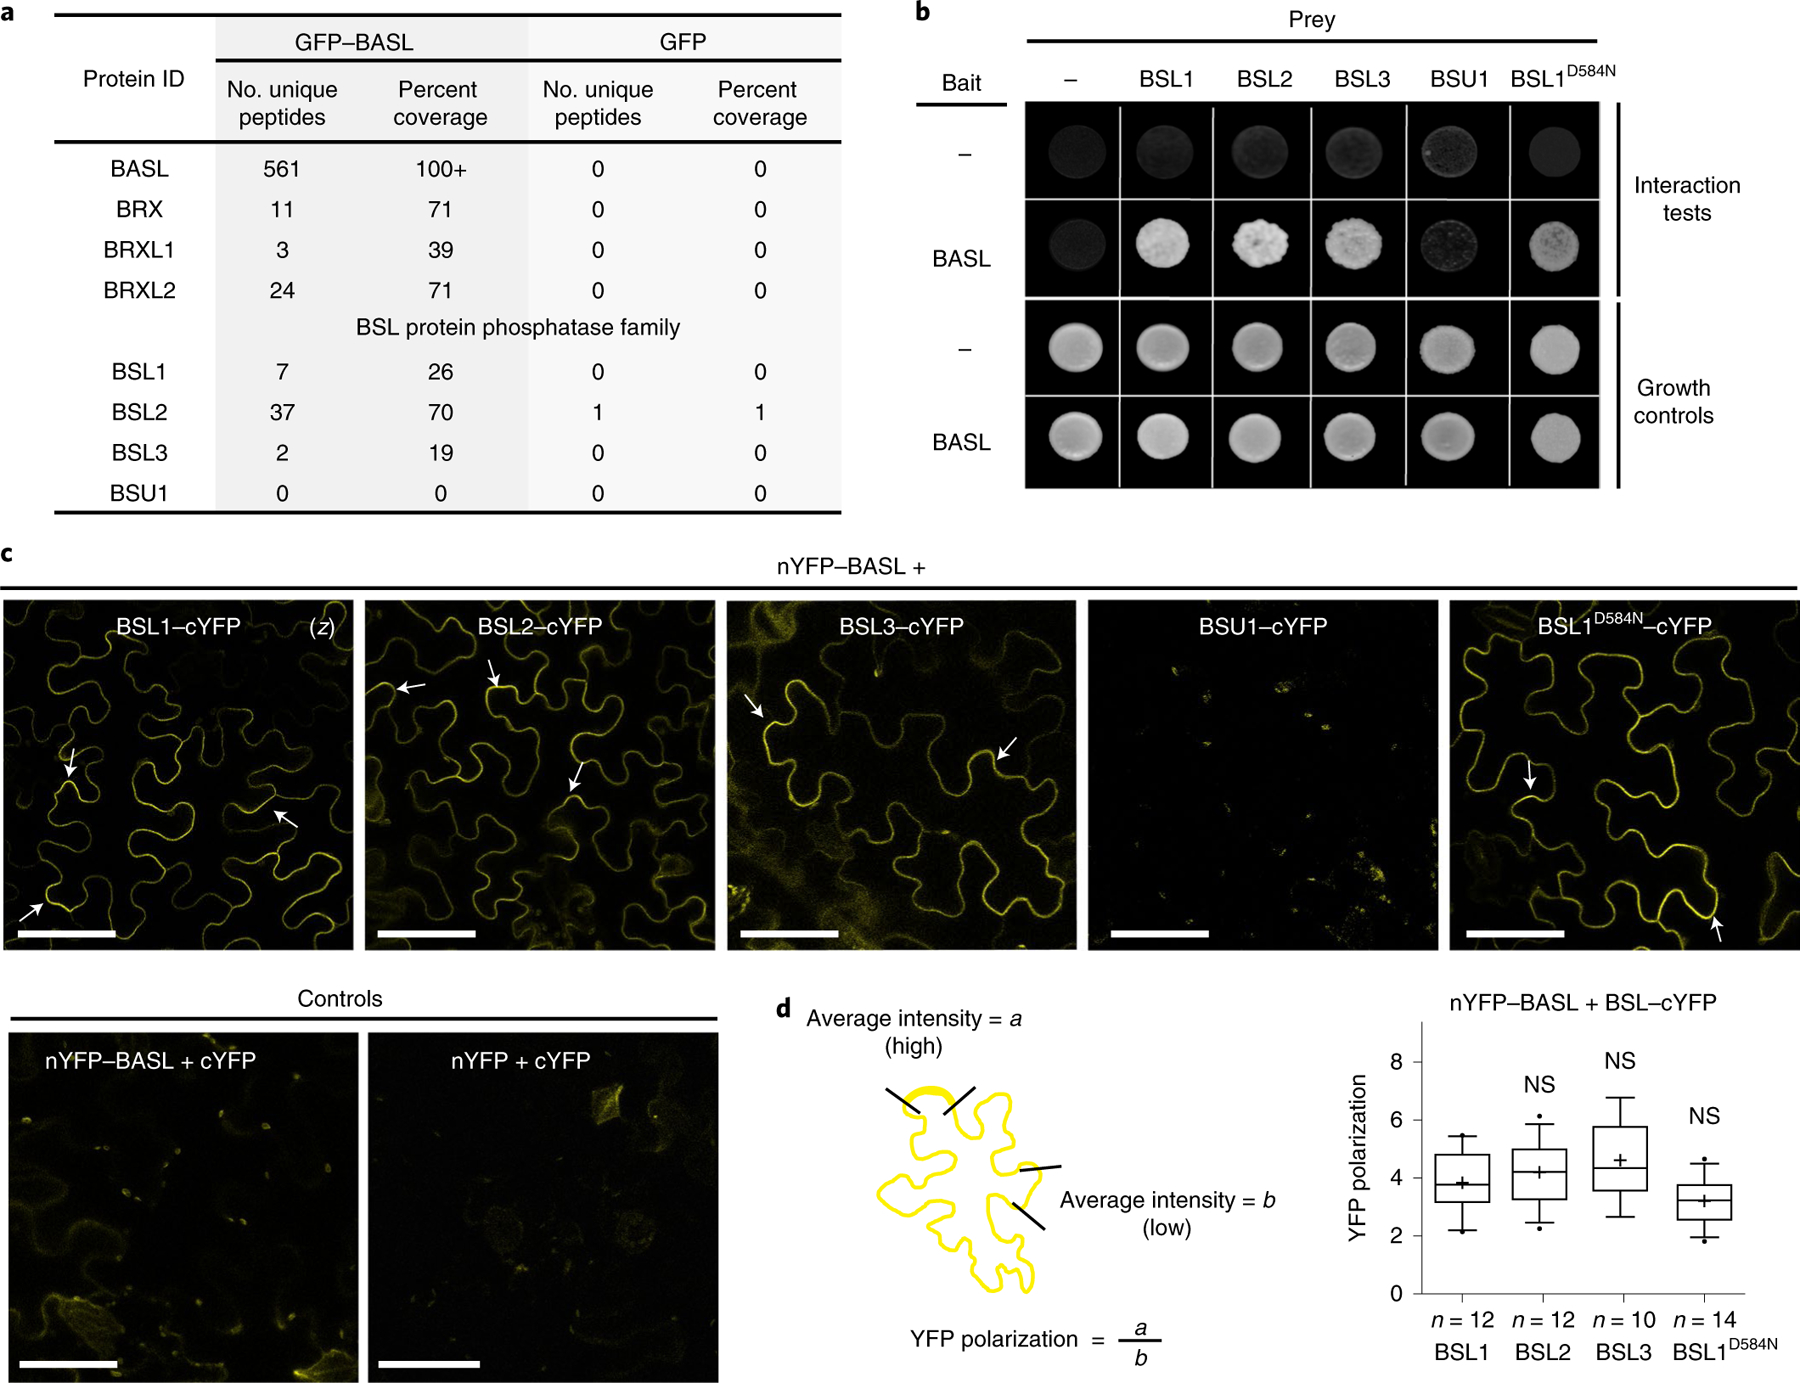
Fig. 1 |. Identification of BSL proteins as putative physical partners of the polarity protein BASL.

a, Identification of BASL-interacting proteins in Arabidopsis using co-IP coupled with MS. Total cell protein from Arabidopsis seedlings expressing GFP–BASL (35Sp::GFP–BASL or BASLp::GFP–BASL;basl-2) were extracted and applied to GFP-Trap agarose beads. Eluted proteins were sent for MS analysis to identify possible interacting proteins. Seedlings expressing GFP alone (BASLp::GFP) were assayed in parallel as control. Detailed MS data can be found in Supplementary Table 1. b, Results of yeast two-hybrid assays showing that BSL proteins directly interact with BASL. For the bait column, the dash indicates the Gal4 DNA-binding domain (BD) while BASL indicates the BD–BASL fusion protein. For the prey row, the dash indicates the Gal4 activation domain (AD) while BSL1, BSL2, BSL3, BSU1 and BSL1D584N indicate BSL–AD protein fusions. Interaction tests indicate assays performed using synthetic dropout medium (-Leu-Trp-His; 1 mM 3-AT added to suppress bait autoactivation), and growth controls indicate assays performed using rich media (-Leu-Trp). c, Results of BiFC assays in N. benthamiana leaf epidermal cells showing that BSL proteins interact with BASL in a polarized manner along the cell periphery (arrows). YFP signals indicate protein–protein interactions. (z), all images are z-stacked confocal images. Scale bar, 50 μm. d, Left: graphic of the method for the quantification of YFP polarization in the BiFC assays. Right: quantification of polarized BASL–BSL interactions. Confocal images were captured using same settings, and z-stacked images were measured to obtain values of absolute fluorescence intensity. Same lengths were selected for a (high fluorescence) or b (low fluorescence), and average intensity values were taken to obtain the ratios of a/b (values > 1 indicate positive polarization). Box plots show the first and third quartiles, split by the median (line) and mean (cross). Two-sided t-test; n, number of cells. NS, not significant.
