
Extended Data Fig. 4 |. Association of BSL1 with the Polarity Complex Promotes BIN2 Partitioning to the Nucleus.
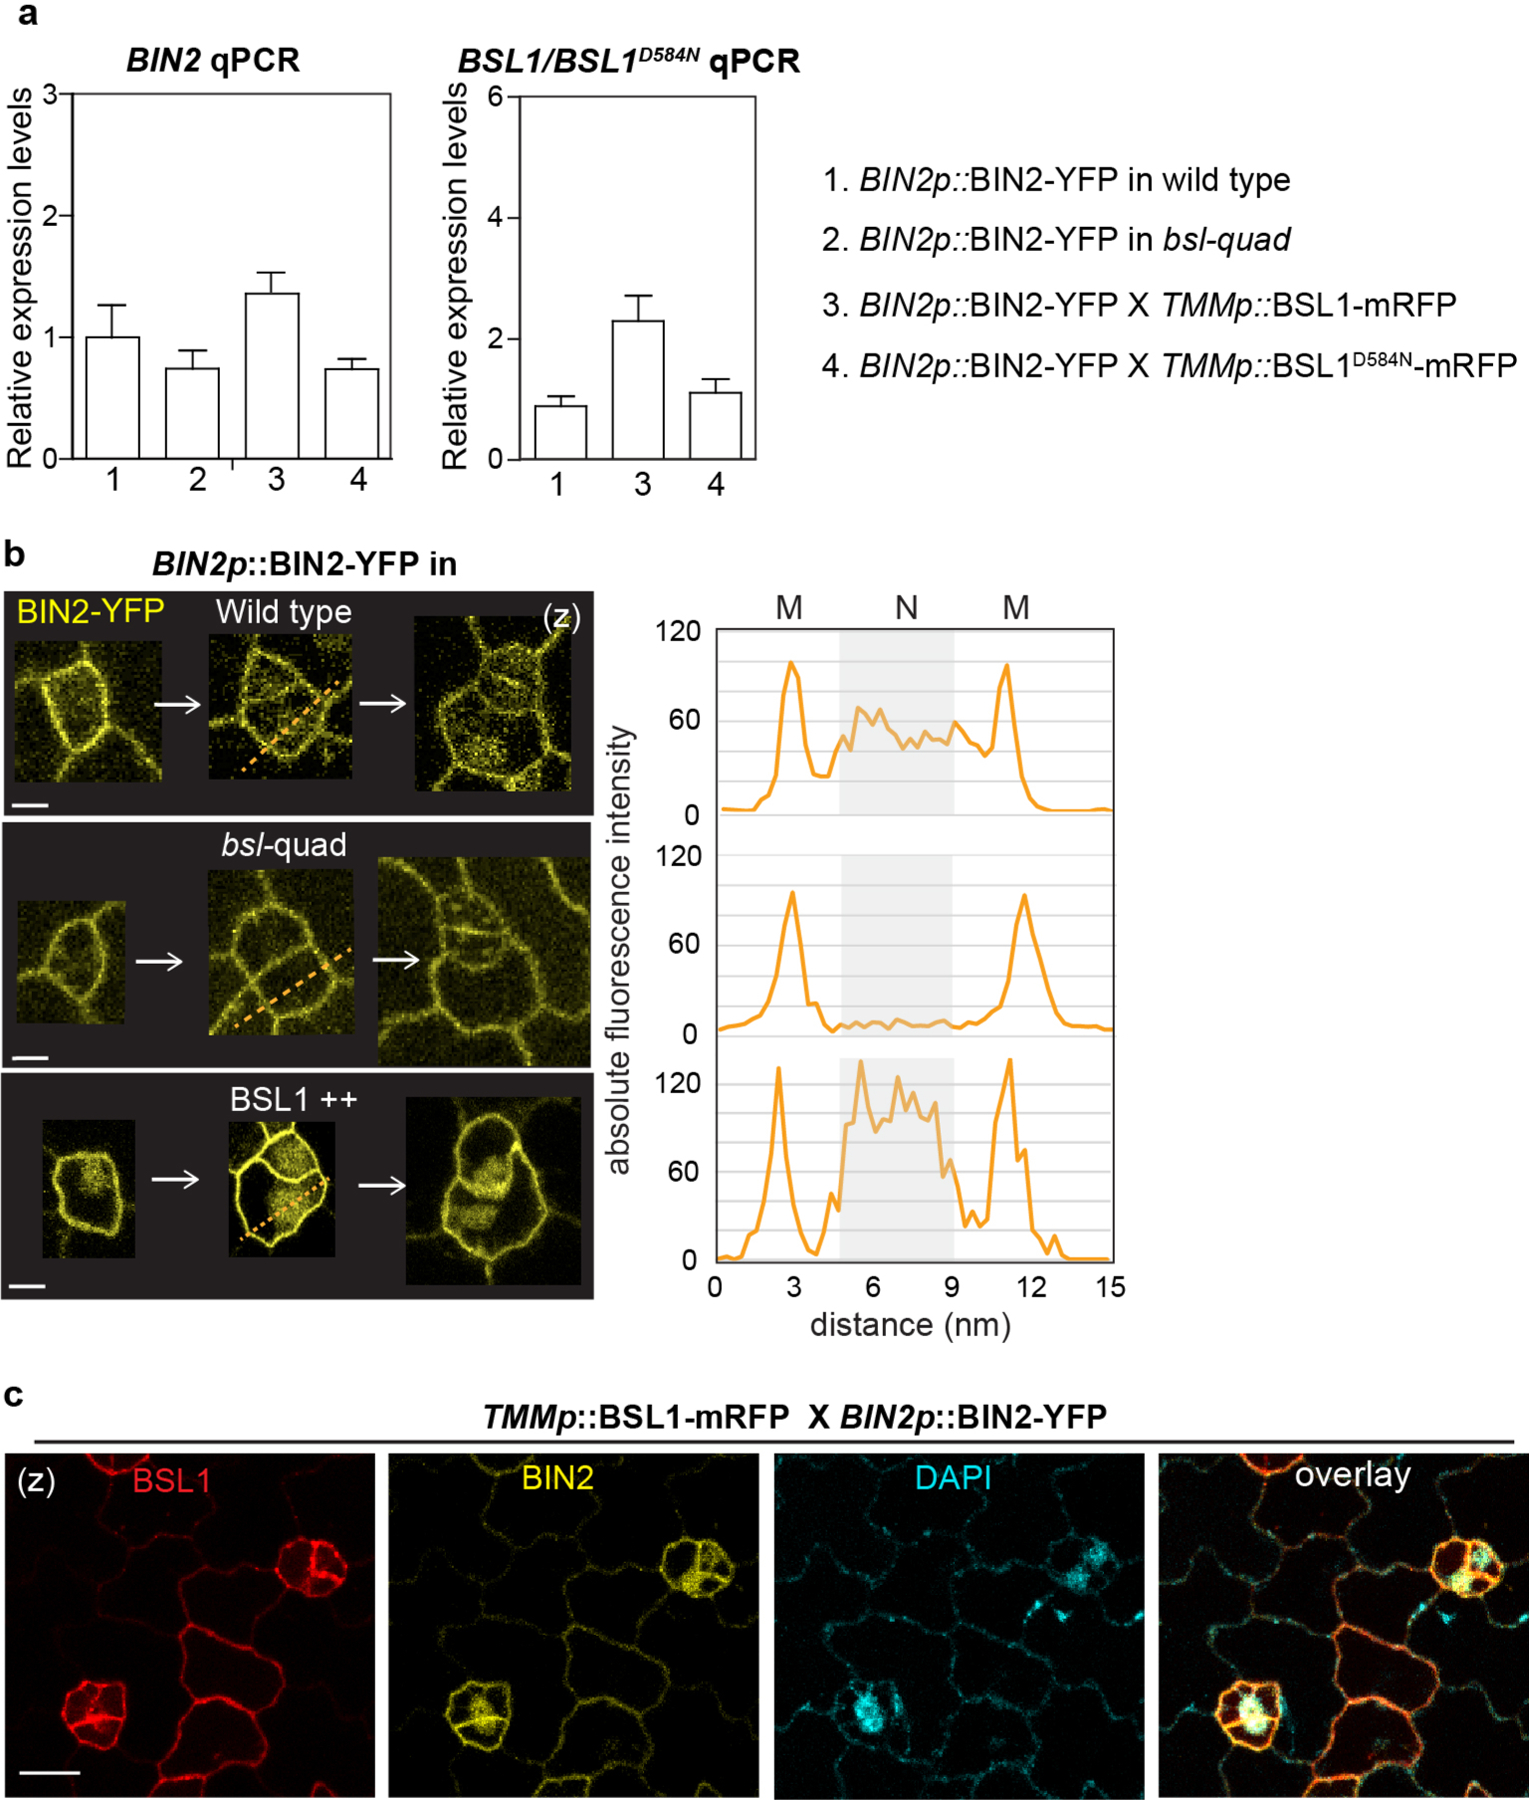
a, qPCR data show relative expression levels of BIN2 (left) and BSL1/BSL1D584N (right) in the indicated genetic backgrounds. Total RNAs were extracted from 3-day-old seedlings. Gene expression levels were normalized by ACTIN2 and relative expression levels of BIN2 or BSL1 were compared with the values in the wild-type background. Data are presented as mean ± SD. n = three independent experiments. Primers used were listed in Supplementary Table 2. b, Representative confocal images show differential membrane/nuclear partitioning of BIN2 (yellow) in stomatal lineage cells from the wild type vs. in bsl-quad mutants vs. in BSL1 overexpression plants (driven by the TMM promoter). The expression of BIN2-YFP is driven by the native promoter. Right, florescence intensity profiling of the dotted lines drawn across the stomatal lineage cells shown on the left. Confocal images were taken with same settings and absolute fluorescence intensity values were obtained and profiled by Fiji. M, cell membrane; N, nucleus. Scale, 5 μm c, Co-expression of the TMM promoter driven BSL1-mRFP (red) with the endogenous promoter driven BIN2-YFP (yellow). The nuclear enrichment of BIN2 was verified by positive DAPI staining (cyan). Scale, 10 μm.