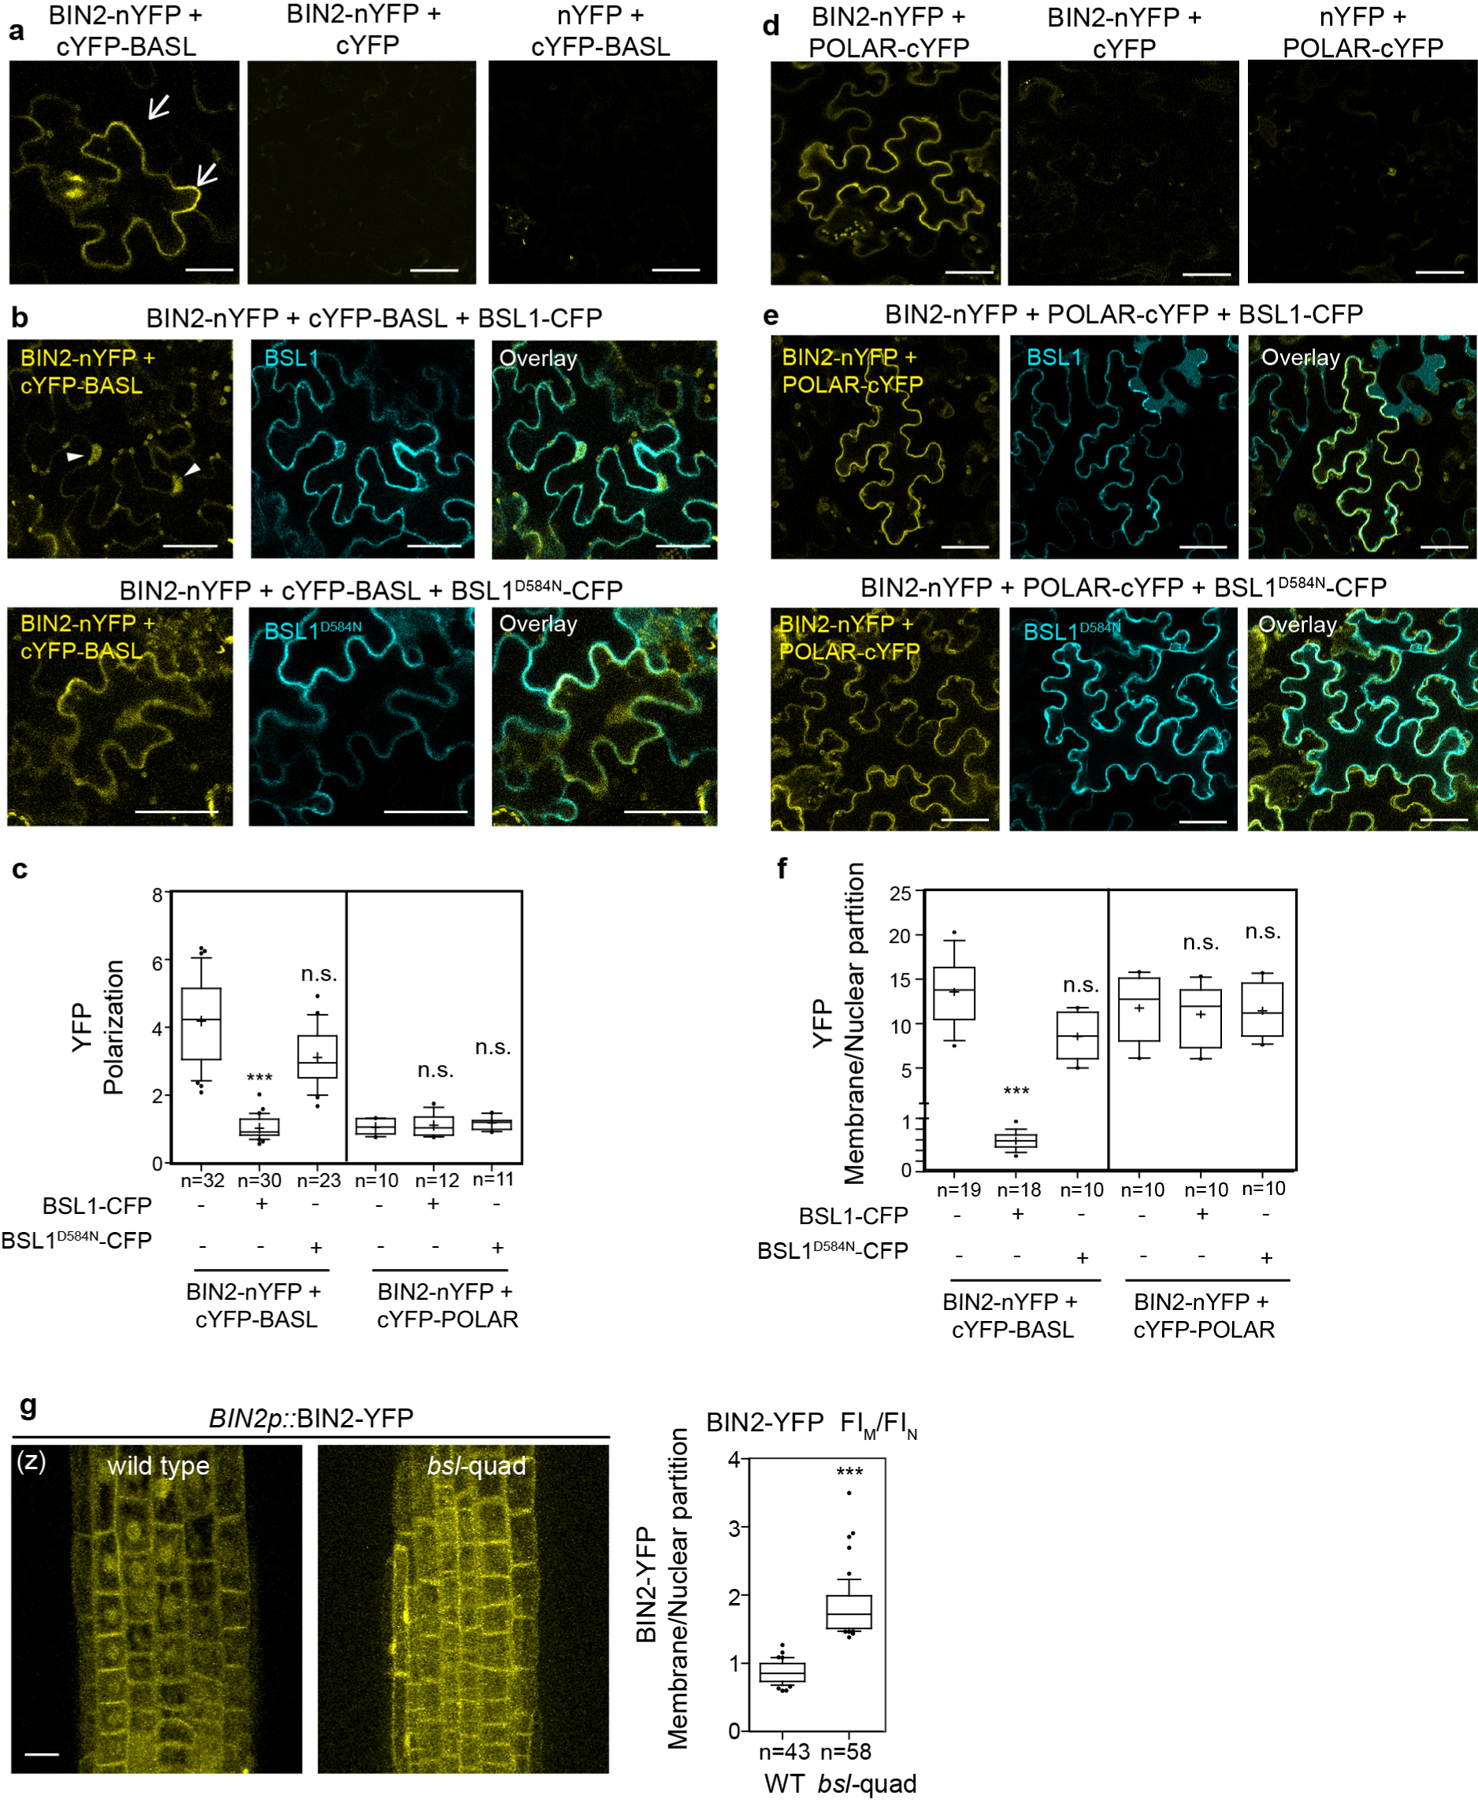
Extended Data Fig. 6 |. BSL1 Interferes the Interaction of BIN2-BASL in Planta.

a, BiFC assays show interactions between BIN2 and BASL (yellow) in N. benthamiana leaves. Half YFPs (nYFP and cYFP) were used as negative controls. Arrows indicate protein polarization in epidermal cells. b, BiFC interaction tests for BIN2-BASL (yellow) in the presence of BSL1-CFP (cyan, top) or BSL1D584N-CFP (cyan, bottom). Note, in the presence of BSL1, YFP signals were found diminished along the cell periphery but increased in the nucleus (arrowheads), suggesting BIN2-BASL interactions at the cell periphery were disturbed by the expression of wild-type BSL1 but not the phosphatase-dead BSL1D584N. Scale bars in (a-b), 50 μm. c, Quantification of YFP polarization at the cell periphery in the BIN2-BASL and BIN2-POLAR BiFC assays. The method for quantification of polarization in the BiFC assays was described in Fig. 1. *** P < 0.0001. n.s., not significant. d, BiFC assays show protein-protein interaction between BIN2 and POLAR (yellow). Half YFPs (nYFP or cYFP) were used as negative controls. e, BiFC assays show the interaction of BIN2-POLAR (yellow) was not changed by the expression of BSL1-CFP (cyan, top) or BSL1D584N-CFP (cyan, bottom). Representative individual cells were chosen from three independent experiments. Scale bars in (d-e), 50 μm. f, Quantification of membrane/nuclear (M/N) partition in the BIN2-BASL and BIN2-POLAR BiFC assays. Average fluorescence intensity values were taken from the cell periphery and from nucleus area for calculation. To generate c and f, confocal images were captured with same settings and absolute fluorescence intensity from z-stacked images were measured by Fiji. Box plot shows first and third quartiles, median (line) and mean (cross). n, number of cells. One-way ANOVA followed by Tukey’s post hoc test were used to compare with their respective control. *** P < 0.0001. n.s., not significant. g, Representative confocal images show differential membrane/nuclear partitioning of BIN2-YFP (driven by the endogenous promoter) in the Arabidopsis root elongation zone of the wild-type vs. in bsl-quad mutants. Scale bars, 10 μm. (z), images are z-stacked. Right, quantification of membrane/nuclear (M/N) partition of BIN2–YFP. Box plot shows first and third quartiles, median (line) and mean (cross). n, number of cells counted. Two-tailed Student’s t-tests were used to compare with in the wild type. *** P < 0.0001.
