
Fig. 2 |. Polarization of BSL1 requires BASL in Arabidopsis.
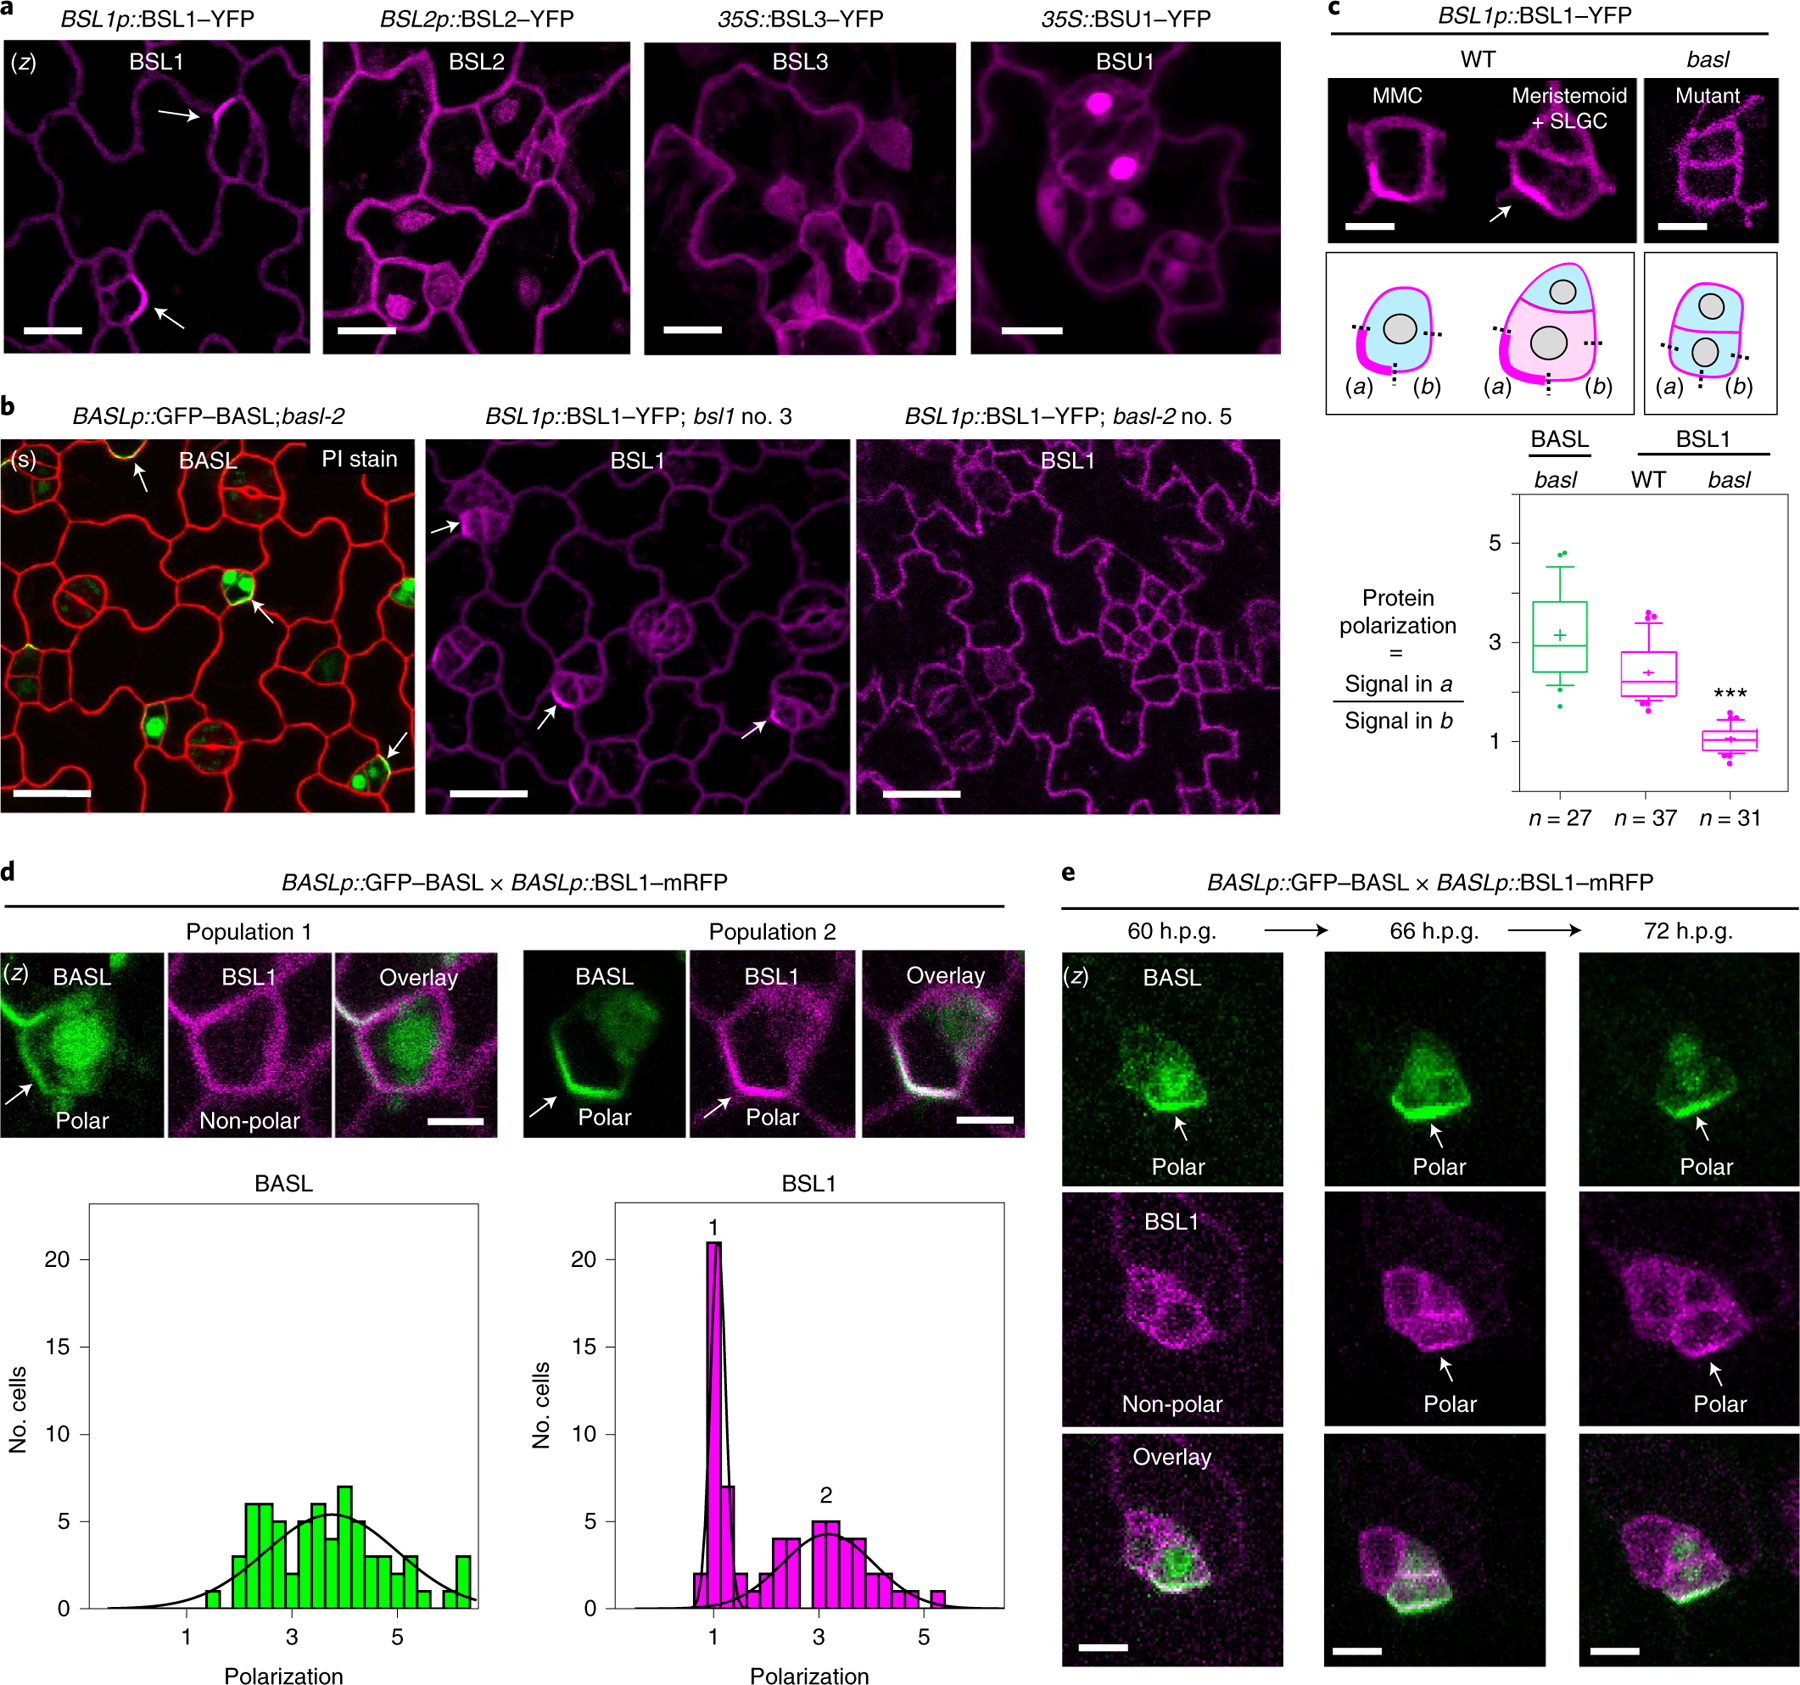
a, Subcellular localization of the BSL proteins (magenta) in stomatal lineage cells in 3-d.p.g. Arabidopsis adaxial cotyledon epidermis. Note that BSL1 is mainly cytoplasmic, close to the cell periphery and polarized (arrow), whereas BSL2, BSL3 and BSU1 are cytoplasmic and nuclear. Scale bar, 10 μm. b, Confocal images showing polarization of BASL (green) and BSL1 (magenta) in stomatal lineage cells (arrows) and the absence of BSL1 polarization in the null basl-2 cells. Images show cells expressing BASLp::GFP–BASL in basl-2 (green, left), BSL1p::BSL1–YFP in bsl1–1 (magenta, middle) and BSL1p::BSL1–YFP in basl-2 (magenta, right) Red, PI staining. (s), single optical sections. Scale bar, 20 μm. c, Quantification of native-promoter-driven BSL1 polarization in wild-type (WT) versus basl-2 plants. Top, representative images and quantification method of BSL1 localization in different backgrounds (magenta). Scale bar, 2 μm. Polarization was calculated as the ratio of the fluorescence in segment a versus b. Bottom, quantitation of BSL1 polarization. Box plot shows first and third quartiles, median (line) and mean (cross). Data were analysed by two-tailed Student’s t-test. n, number of stomatal lineage cells. ***P < 0.0001. d, Differential polarization of BASL and BSL1 (arrows) in MMCs. Top, representative images of cells in indicated populations of MMCs containing BSL1–mRFP (magenta) and GFP–BASL (green). Scale bar, 2 μm. Bottom, histograms of polarization values for BASL and BSL1. The two curves correspond to the two populations demonstrated above. n = 68 cell co-expressing GFP–BASL and BSL1–mRFP, both driven by the BASL promoter, in a true leaf of a 5-d.p.g. seedling. e, Time-course confocal images showing the differential polarization timing of GFP–BASL (green) and BSL1– mRFP (magenta) at three successive intervals of time during an ACD. Left, before ACD; middle, during ACD; and right, after ACD. (z), images are z-stacked. Scale bar, 5 μm.