
Fig. 3 |. The association of BSL1 with the polarity complex occurs in MMCs at the entry of mitosis.
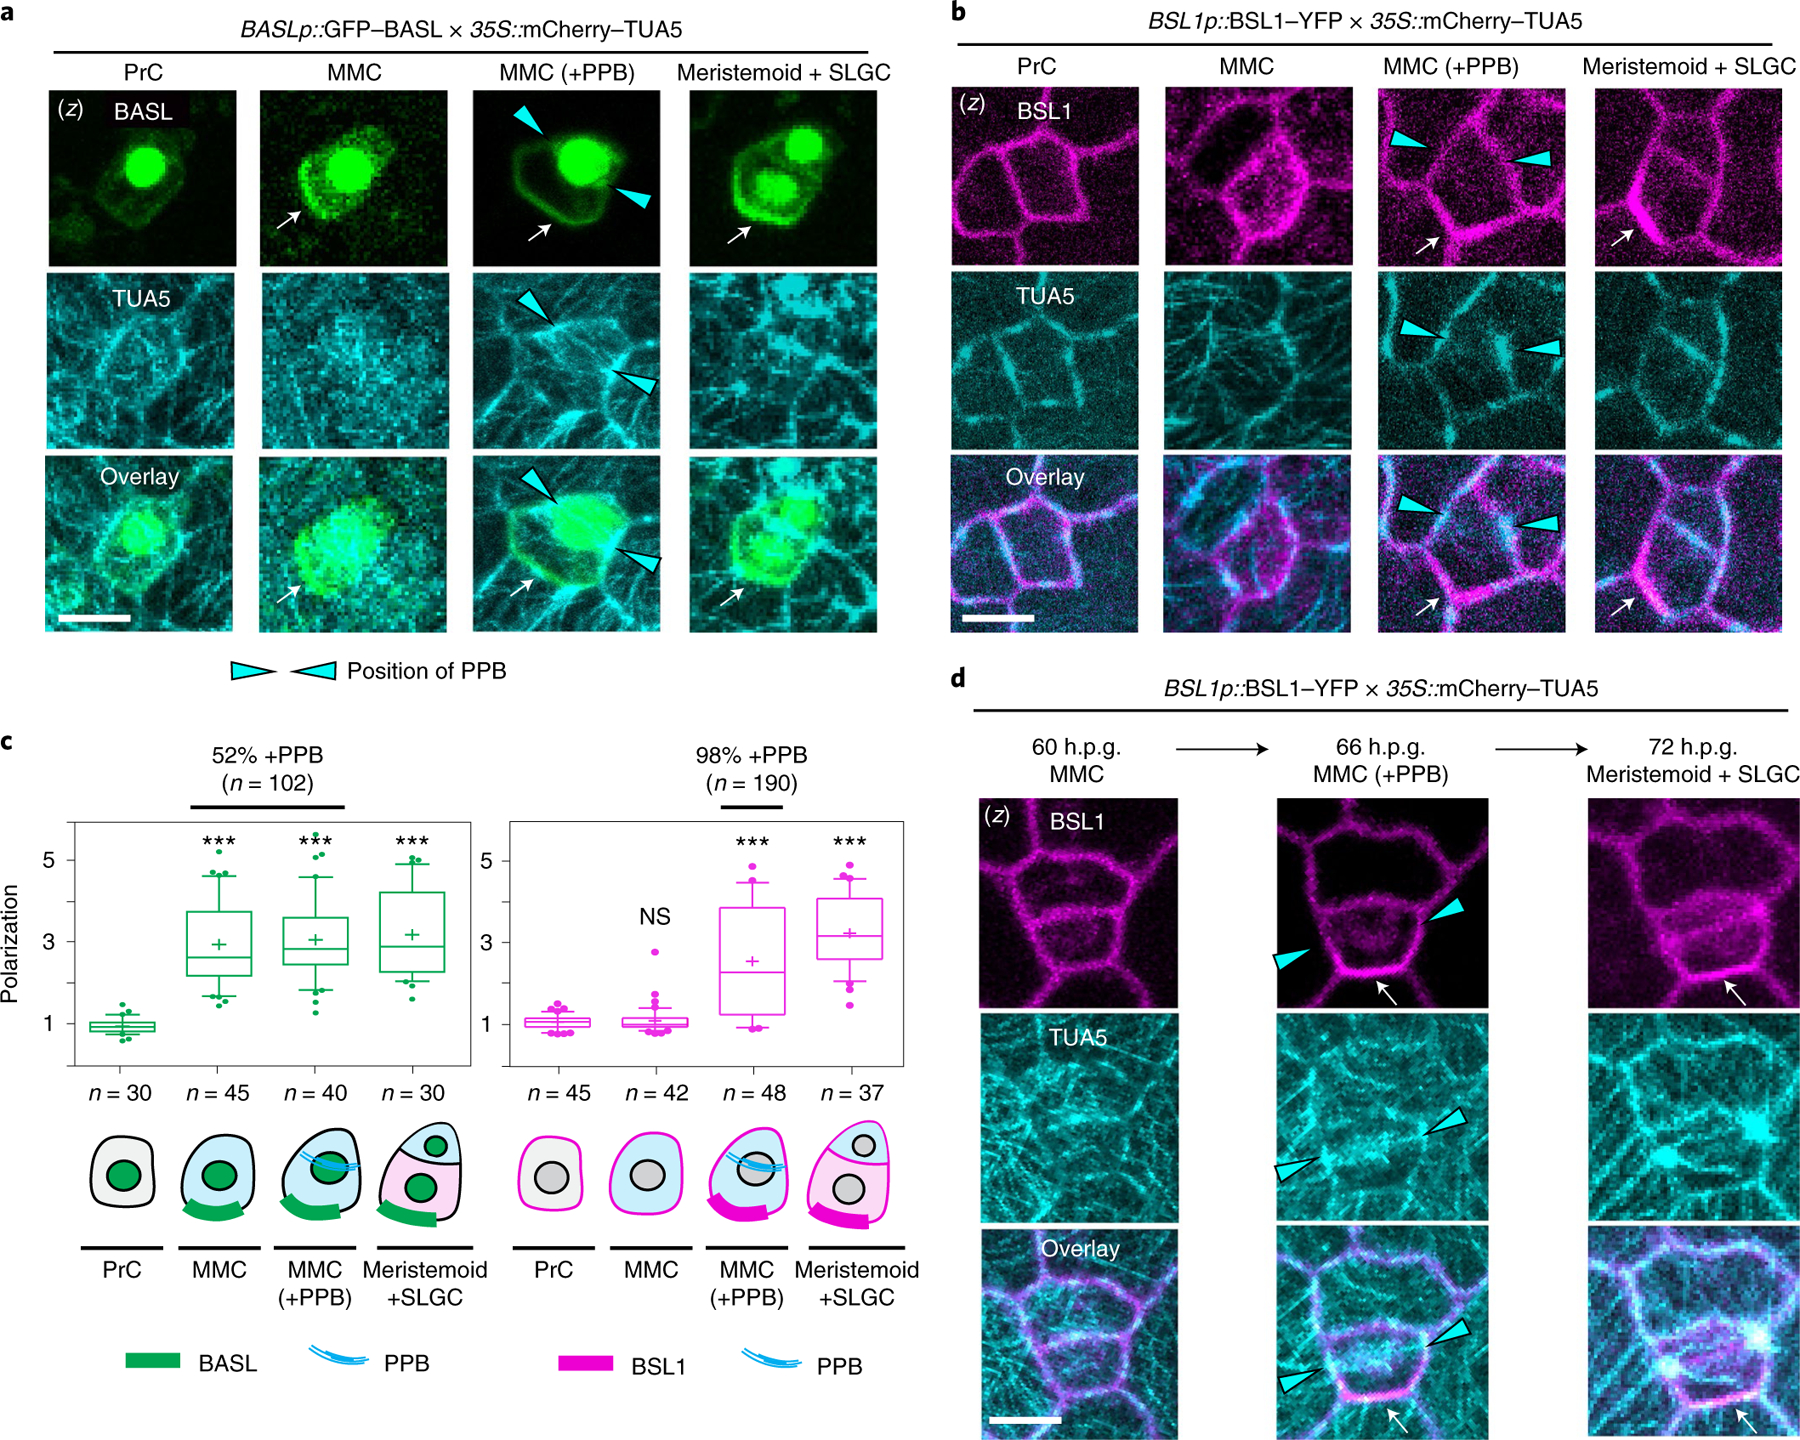
a,b, BSL1 polarization coincides with the formation of the PPB. Images show the co-expression of BASLp::GFP–BASL (a, green) or BSL1p::BSL1–YFP (b, magenta) with the ubiquitous 35S-promoter-driven microtubule marker mCherry–TUA5 (cyan) in consecutive cell types (PrC, MMC, MMC with PPB and SLGC) during stomatal ACD. The expression of mCherry–TUA5 allows visualization of the formation of the PPB (cyan arrowheads) during mitosis. Arrows indicate protein polarization. Scale bar, 5 μm. c, Quantification of protein polarization of BASL (left) and BSL1 (right) in successive cell types shown in a and b. Values > 1 indicate positive polarization. Box plots show first and third quartiles, median (line) and mean (cross). One-way ANOVA with Tukey’s post-hoc tests were performed to compare the values for designated cell type with the values for the PrC. n, number of cells counted. ***P < 0.0001. The percentage indicates the MMCs containing PPB among the MMCs exhibiting polarized BASL or BSL1 (n, number MMCs with polarized BASL or BSL1). d, Time-lapse images showing that BSL1 polarization (magenta) coincides with PPB formation (cyan arrowheads) during an ACD. Left, before ACD; middle, during ACD; right, after ACD. Arrows indicate protein polarization. Scale, 5 μm. (z), z-stacked confocal images in a, b and d.