
Extended Data Fig. 3 |. BSL1, BSL2 and BSL3 Co-localize with BASL in Arabidopsis.
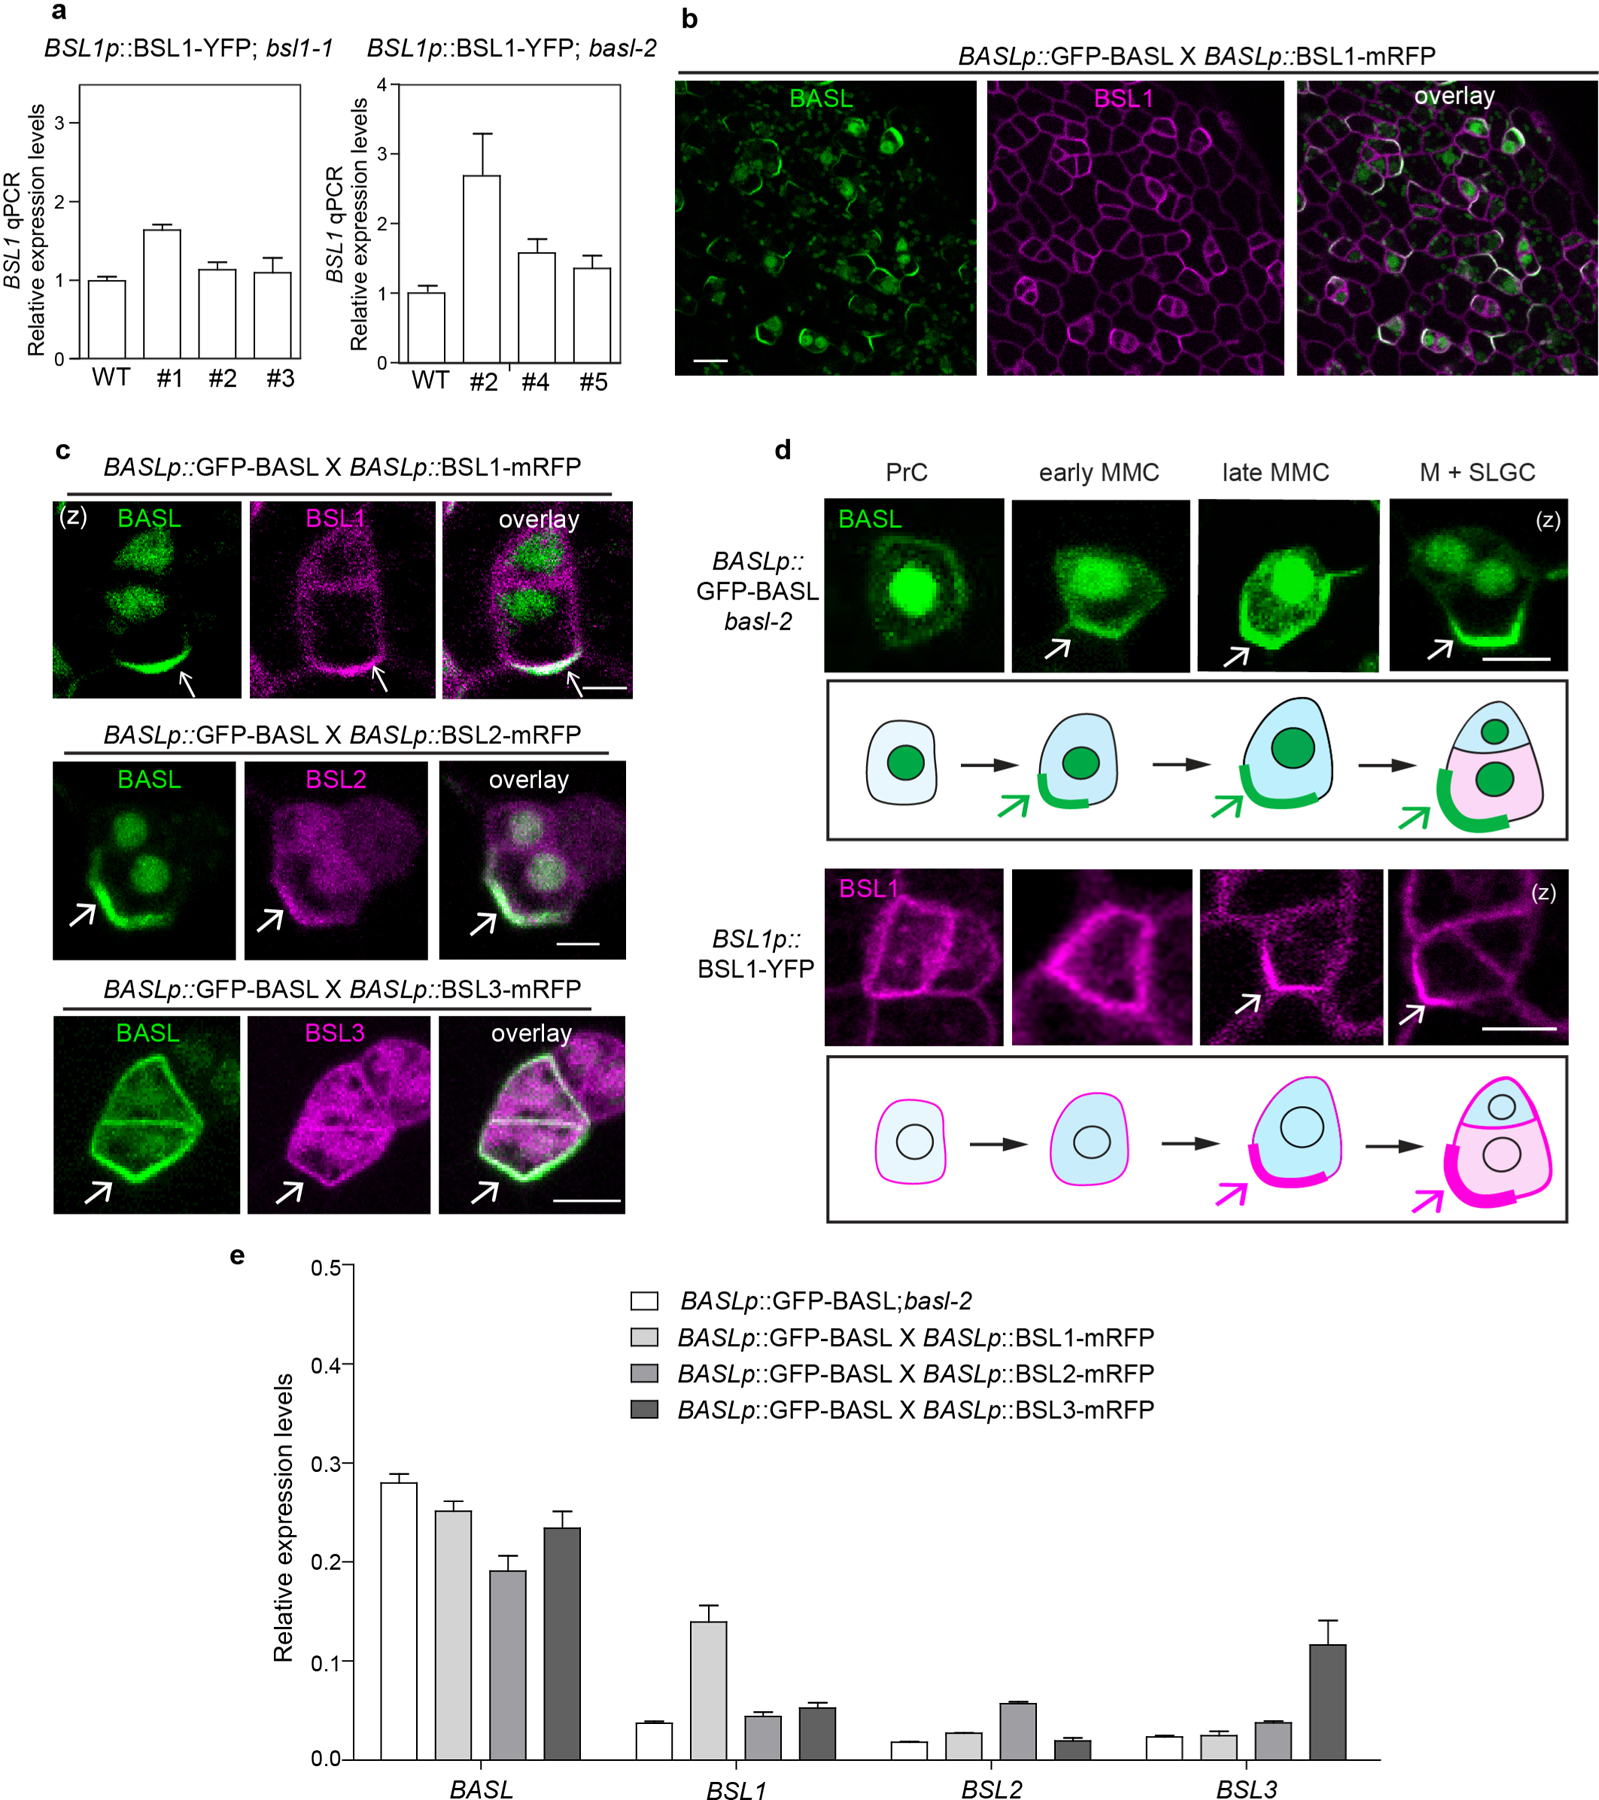
a, qPCR data show relative expression levels of BSL1 (driven by the native promoter) in bsl1 (left) or basl-2 (right). Three independent transgenic lines were used. Total RNAs were extracted from 3-day-old seedlings. Gene expression levels were normalized by ACTIN2 and relative expression levels of BSL1 were compared with the values in the wild type. Data are presented as mean ± SD. n = three independent experiments. b, Co-expression of GFP-BASL (green) with BSL1-mRFP (magenta), both driven by the BASL promoter, in a true leaf of 5-dpg seedling. c, Representative images of co-localization of BSL1-mRFP, BSL2-mRFP and BSL3-mRFP (magenta) with GFP-BASL (green), all driven by the BASL promoter. Arrows mark protein polarization at the cell cortex. d, Expression patterns of endogenous promoter driven GFP-BASL (green) and BSL1-YFP (magenta) in progressive cell types during stomatal development. PrC (protodermal cells), early MMC (Meristemoid Mother Cell, small and rectangular), late MMC (asymmetrically expanded and triangle), M (Meristemoid), and SLGC (Stomatal Lineage Ground Cell). Protein polarizations were indicated by arrows. Scale bars in (b-d), 5 μm. e, qPCR data show relative expression levels of BASL and BSL in indicated genetic backgrounds. Total RNAs were extracted from 3-day-old seedlings. Gene expression levels were relative to ACTIN2. Data are presented as mean ± SD. n = three independent experiments. Primers used were listed in Supplementary Table 2.