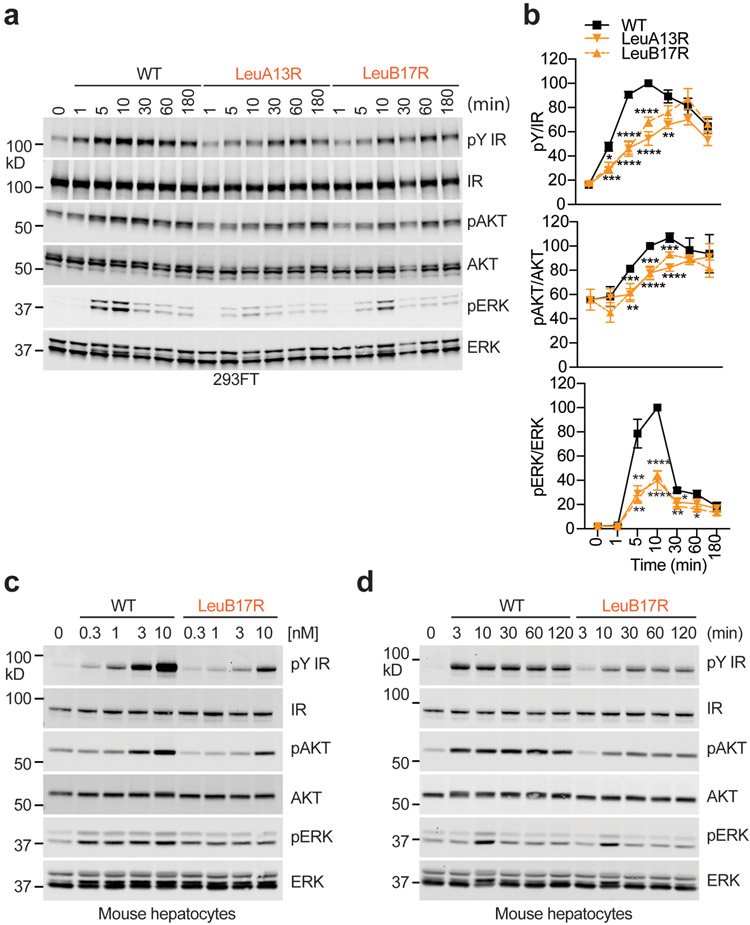
Extended Data Fig. 7. Insulin binding to site-2 of IR facilitates IR activation and signaling.
a. IR signaling in 293FT cells expressing IR wild-type (WT). Cells were treated with the 10 nM insulin WT and site-2 mutants for the indicated times. Cell lysates were blotted with the indicated antibodies.
b. Quantification of the western blot data shown in a (Mean ± SEM, For pY/IR, n=7 independent experiments; pAKT/AKT, n=4, pERK/ERK, n=6). Significance calculated using two-tailed student t-test; *p<0.05; **p<0.01, ***p<0.001, and ****p<0.0001 (The exact p values are provided in the source data).
c. IR signaling in primary mouse hepatocytes treated with the indicated concentrations of insulin for 10 min. Cell lysates were blotted with the indicated antibodies. Quantification of the western blot data shown in Fig. 4e.
d. IR signaling in primary mouse hepatocytes treated with 10 nM insulin for the indicated times. Cell lysates were blotted with the indicated antibodies. Quantification of the western blot data shown in Fig. 4g. Uncropped images for all blots and gels are available as source data.

