
Figure 3.
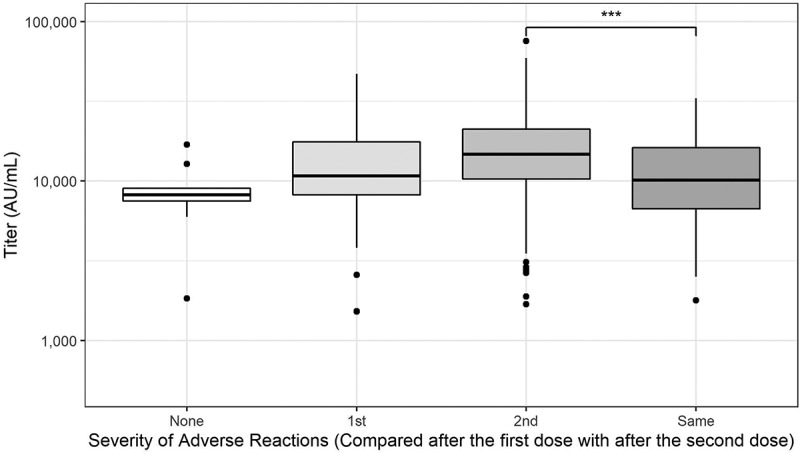
Severity of adverse reactions (compared with those post first and second doses).
Box plots of anti-spike IgG titers after second vaccination showing themedian, quartiles, and outliers. The following four groups were included: “None,”“1st,” “2nd,” and “Same” representing participants whohad no reactions after either dose, stronger reactions after 1stdose, stronger reactions after 2nd dose, and same level of reactionsafter the 1st and 2nd doses, respectively. IgG levels in participantswho had stronger reactions after 2nd dose were higher than levels inparticipants who had same level of reactions after the 1st and 2nddoses (***P < .001).