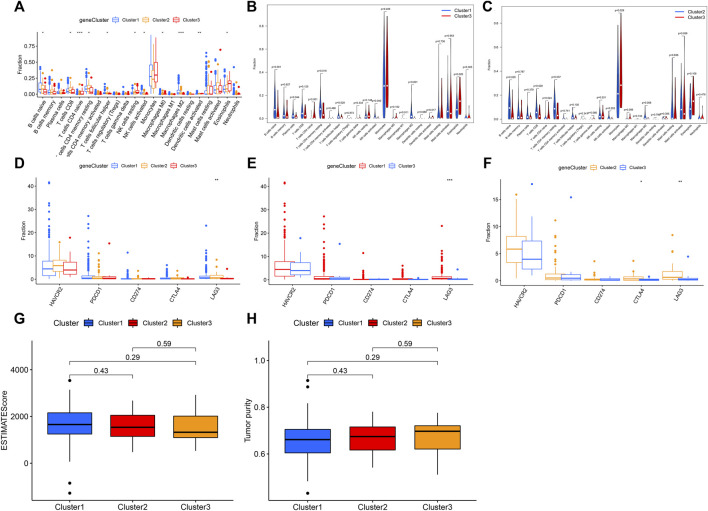
FIGURE 4.
Immunological analysis among different clusters. (A) Content of 22 immune cell types in three clusters. (B) Content of 22 immune cell types between cluster 1 and cluster 3. (C) Content of 22 immune cell types between cluster 2 and cluster 3. (D) Five immune checkpoint expressions in three clusters. (E) Five immune checkpoint expressions between cluster 1 and cluster 3. (F) Five immune checkpoint expressions between cluster 2 and cluster 3. (G) Differences in the estimate score between the three clusters. (H) Differences in tumor purity between the three clusters.

