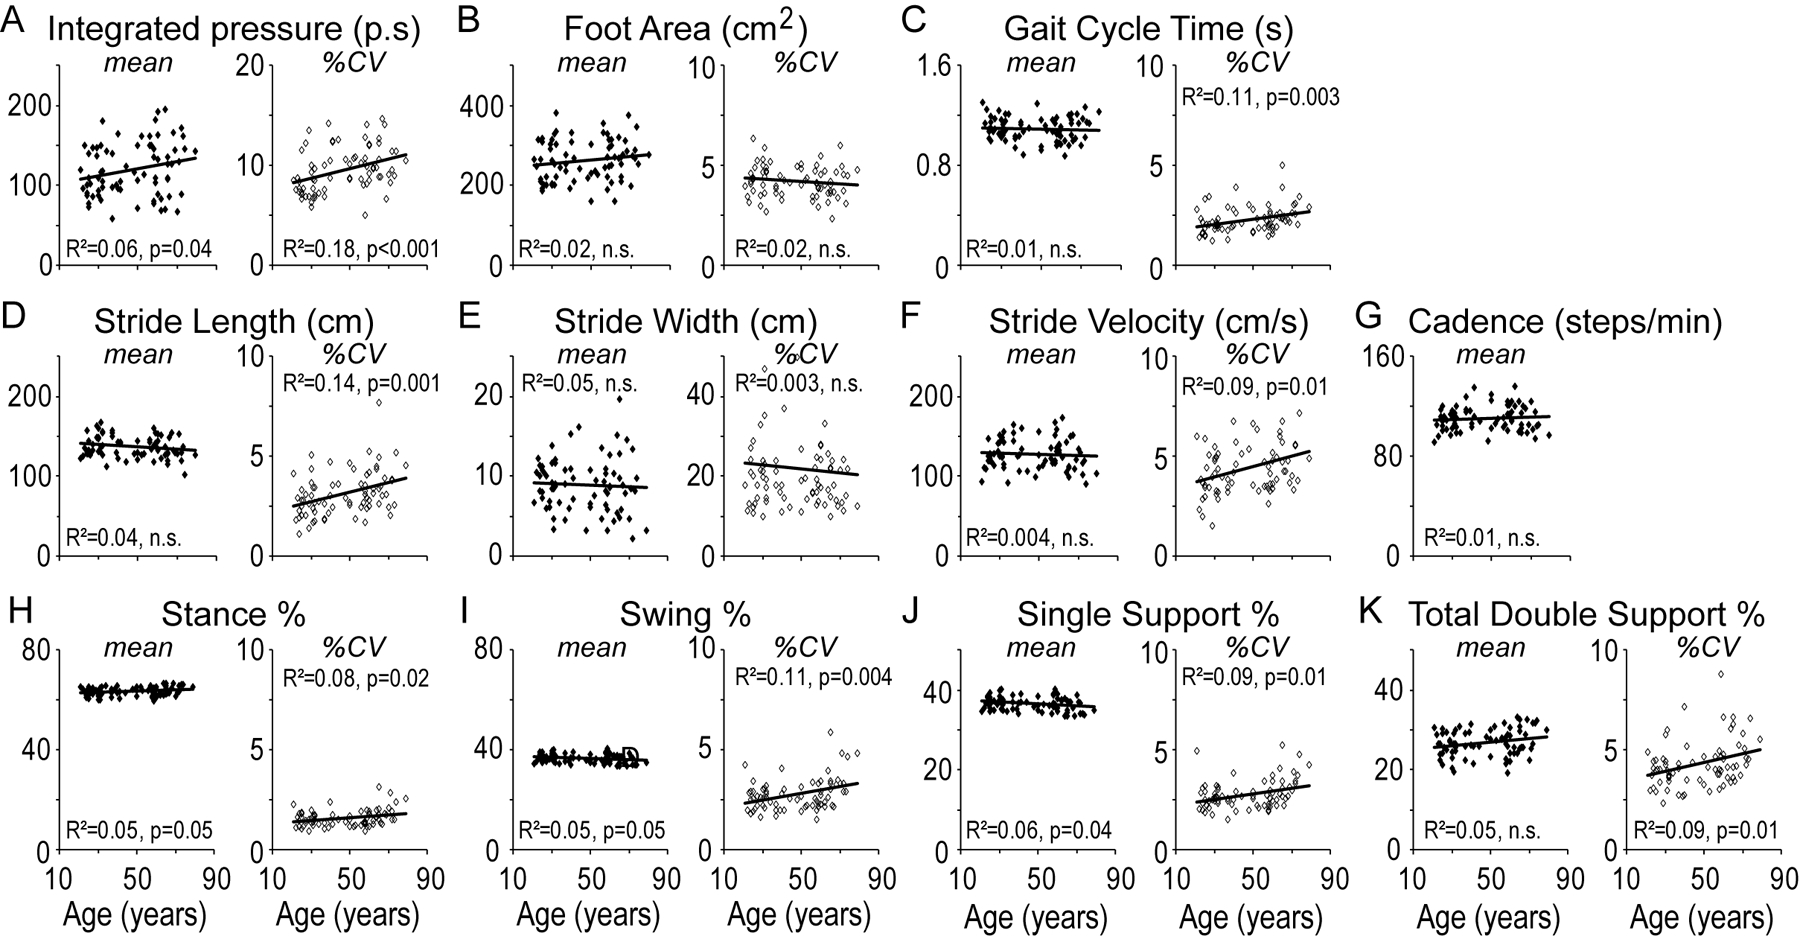
Figure 1. Steady state gait.

Mean (left panel, filled diamonds) and stride-to-stride variability (%CV; right panel, unfilled diamonds) in objective gait measures as a function of age shown for the parameters of (A) Integrated-pressure, (B) Foot Area, (C) Gait Cycle Time, (D) Stride-length, (E) Stride Width, (F) Stride Velocity, (G) Cadence, (H) Stance Percent, (I) Swing Percent, (J) Single Support Percent and (K) Total Double Support Percent. Statistical values are reported for ANOVA.
