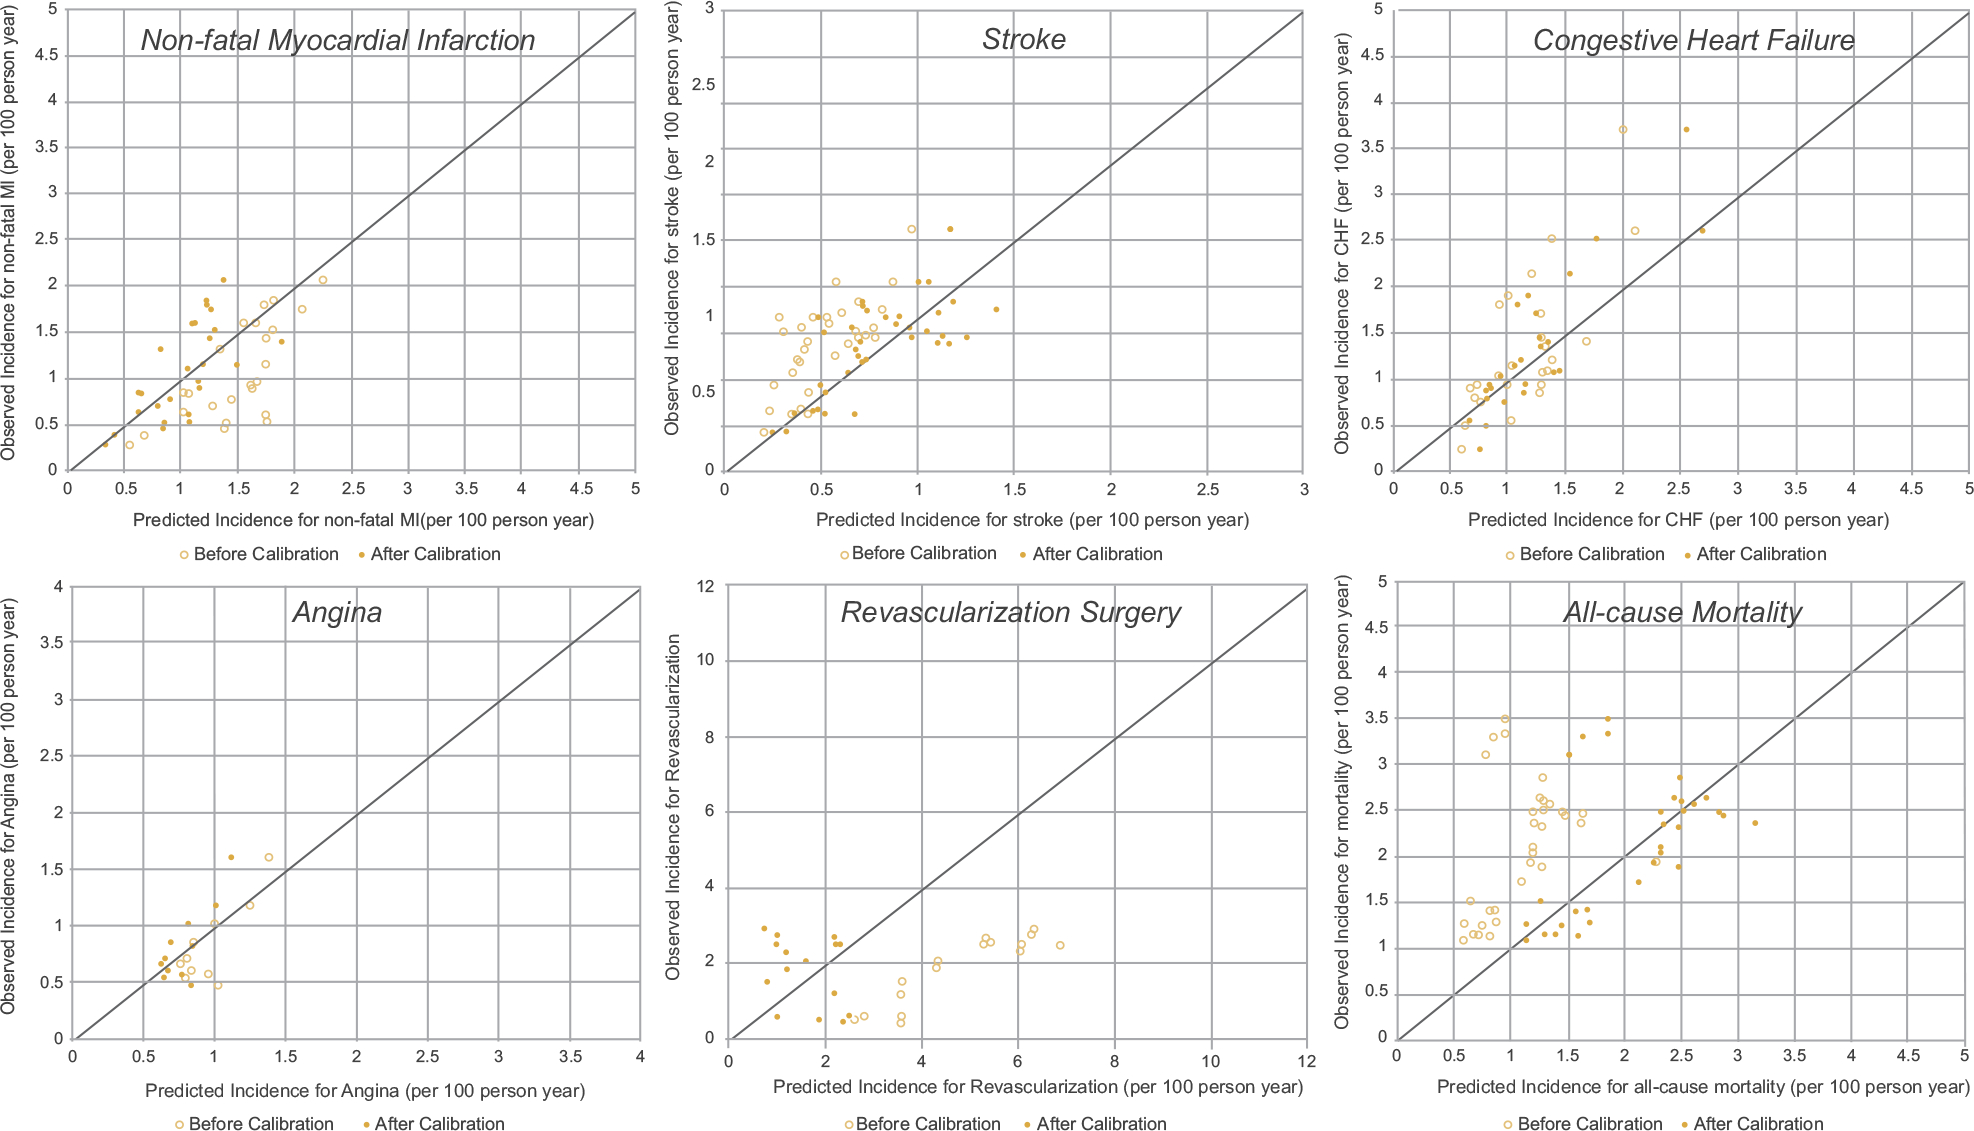
Figure 3.

Calibration plots for risk equations. Perfect predictions are indicated by points located on the 45-degree line. Hollow dots denote predictions before calibration, whereas solid dots denote predictions after adding regional multipliers to the Building, Relating, Assessing, and Validating Outcomes model.
