
Fig. 2.
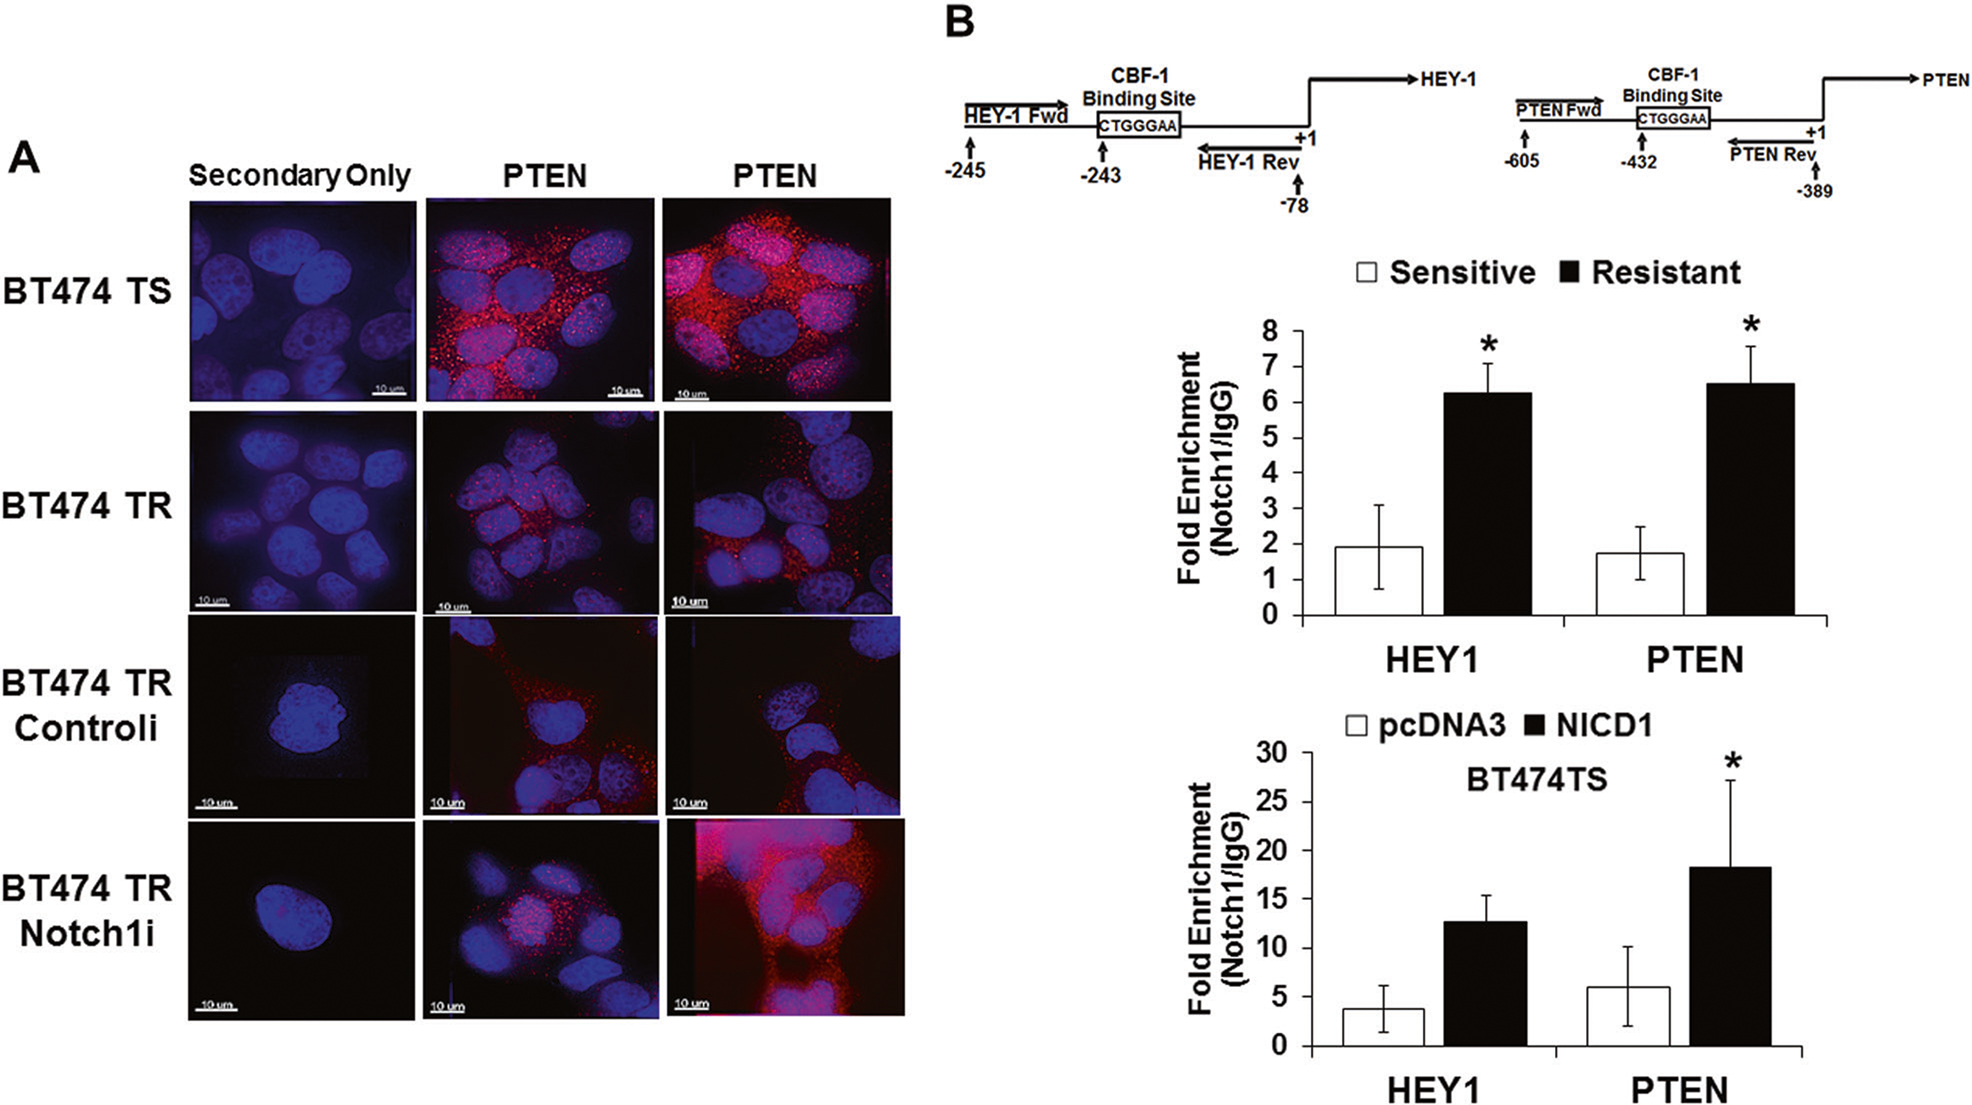
Localization and expression of PTEN in trastuzumab sensitive and resistant cells and recruitment of Notch-1 to the PTEN promoter. a Confocal immunofluorescence was performed on both BT474TS and TR cells to detect PTEN protein expression and cellular localization under conditions where BT474TR cells were transfected with a control siRNA or a Notch-1 siRNA. Scale bar = 10 μm. b BT474TR and BT474TS cells were fixed, fragmented, and chromatin was immunoprecipitated by a Notch-1 or control IgG antibody. Purified DNA from Notch-1 or IgG immunoprecipitated chromatin was used to quantify NICD1 enrichment on HEY-1 or PTEN promoters by real-time PCR using primers flanking a CSL site (maps above bar graphs) (upper graph). BT474TS cells were transfected with a vector control (pcDNA3) or NICD1-expression vector (NICD1) for 48 h. Post transfection, cells were collected, fixed, fragmented, immunoprecipitated by a C-terminal Notch-1 or control IgG antibody and NICD1 enrichment on HEY-1 or PTEN promoters was quantified by real-time PCR using HEY-1 or PTEN primers that flanked a CSL element (lower graph). Asterisk (*) represents statistical significance between sensitive and resistant (upper graph) or between pcDNA3 and NICD1 (lower graph) from three independent experiments using a Student’s t-test