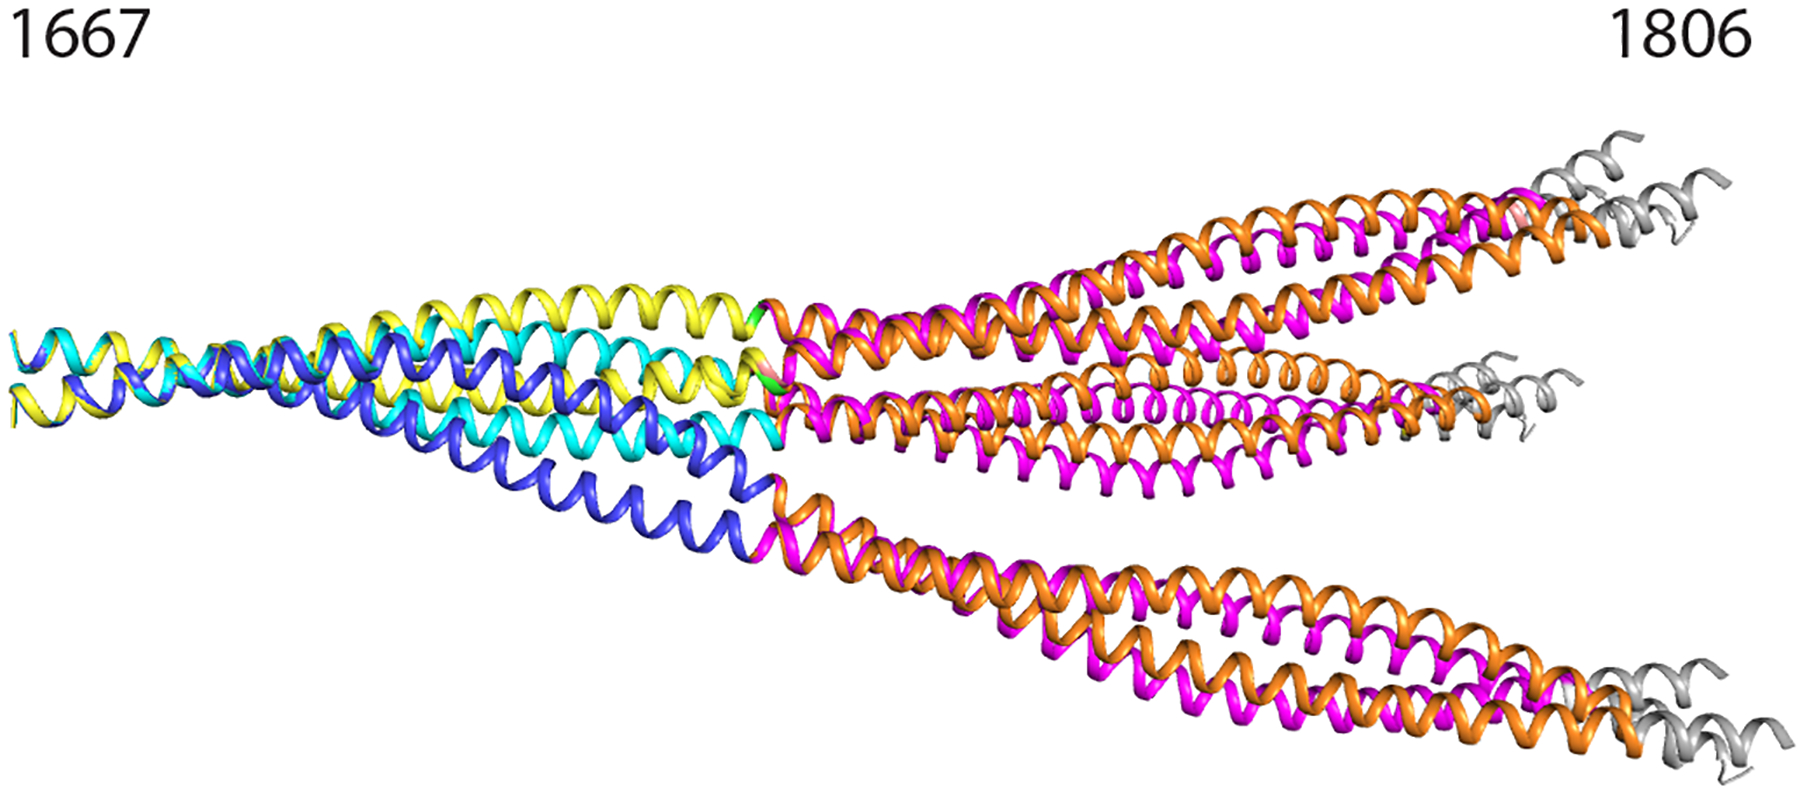
Figure 5. Composite preliminary models for the myosin rod extending from Arg1677 – Gly1807.

Composite model showing six conformations of myosin rod between amino acids 1677–1807. Models were overlapped from residues 1677–1691. Blue chains represent chains A and B of Xrcc4-1677-1758. Cyan chains represent chains C and D of Xrcc4-1677-1758. Yellow chains represent Gp7-1677-1755-Eb1. Orange chains represent Xrcc4-1733-1797. Magenta chains represent Gp7-1733-1797. Grey chains represent residues 1798–1807 of the published structure up to the skip 4 residue (PDB ID: 4XA6).
