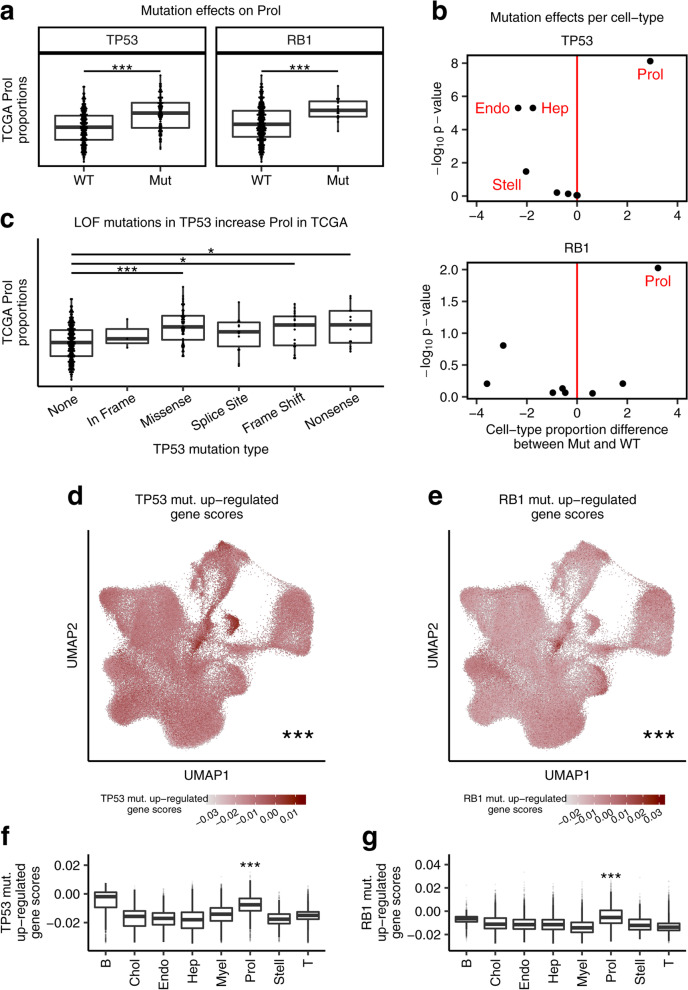
Fig. 4.
Associations between estimated cell-type proportions and somatic mutations in the TCGA cohort link TP53 and RB1 mutations to increased Prol abundance. Mutations associated with changes in the bulk TCGA liver proportion estimates of the Prol cell-type. a Prol proportion estimates are significantly higher in the HCC cases harboring a mutation (Mut) in TP53 (left panel) and RB1 (right panel) compared to those with both wildtype (WT) alleles. b The Prol cell type is highlighted as the only cell-type significantly increased in HCC cases with Mut TP53 and Mut RB1. Differential abundance for the 8 cell-types testing for differences in proportions between Mut vs. WT TP53 (top panel) and RB1 (bottom panel) cases. Differential abundance was performed with a Wilcoxon test (n = 357 tumor samples). The difference in means of the scaled proportions is plotted in the x-axis and the -log10 p-value in the y-axis. The vertical red line (x = 0) indicates no difference. c Prol proportion estimates are plotted against no TP53 mutation (None) and different TP53 mutation types. Prol estimates are significantly increased in individuals with loss of function (LOF) mutations in TP53. d–g The cells/nuclei in the Prol cell-type significantly express mutation-upregulated genes, as shown by the droplet module scores of mutation upregulated genes for the indicated mutation in TCGA. Mutation upregulated genes were derived by running genome-wide differential expression (DE) between patients with and without a somatic mutation in the indicated gene and taking those over-expressed in HCC patients harboring a mutation and with an FDR-adjusted p value less than 0.05. Droplet module scores were calculated by comparing the average expression of mutation upregulated genes to a background set of genes. d, e UMAP of the single-cell-level data showing droplets colored by scores for genes upregulated in patients with (d) TP53 and (e) RB1 mutations. f, g Bar plots of the (e) TP53 mutation upregulated scores and (g) RB1 mutation upregulated scores separated by cell-type. d, g Asterisks denote a significant increase in mutation upregulated gene scores between Prol and non-Prol cells/nuclei as assessed by a Wilcoxon test. Significance levels for nominal p-values in (a, c, d-g): *p < 0.05, **p < 0.005, ***p < 0.0005

