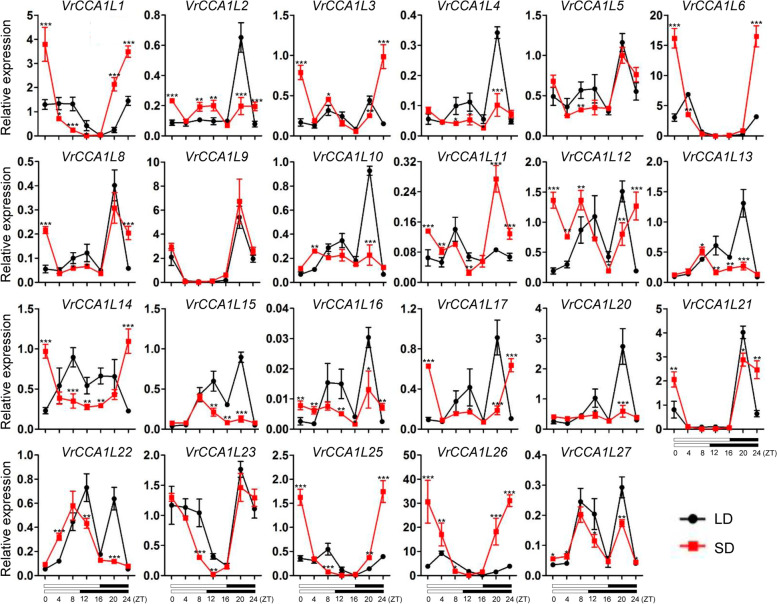
Fig. 7.
Expression analysis of the VrCCA1L genes throughout the day under LD and SD conditions. The photoperiod treatments were 16 h light/8 h dark and 10 h light/14 h dark cycles for LD and SD conditions, respectively. ZT, Zeitgeber Time. The x-axis indicates the light and dark cycle throughout the day. Open boxes indicate the time of lights-on, and black boxes indicate the time of darkness. Red lines indicate SD and black lines mean LD. Expression levels of the VrCCA1Ls were normalized to that of an Actin gene from mungbean. Significant differences relative to the expression under LD conditions are indicated with asterisks (***P < 0.001; **P < 0.01; and *P < 0.05)

