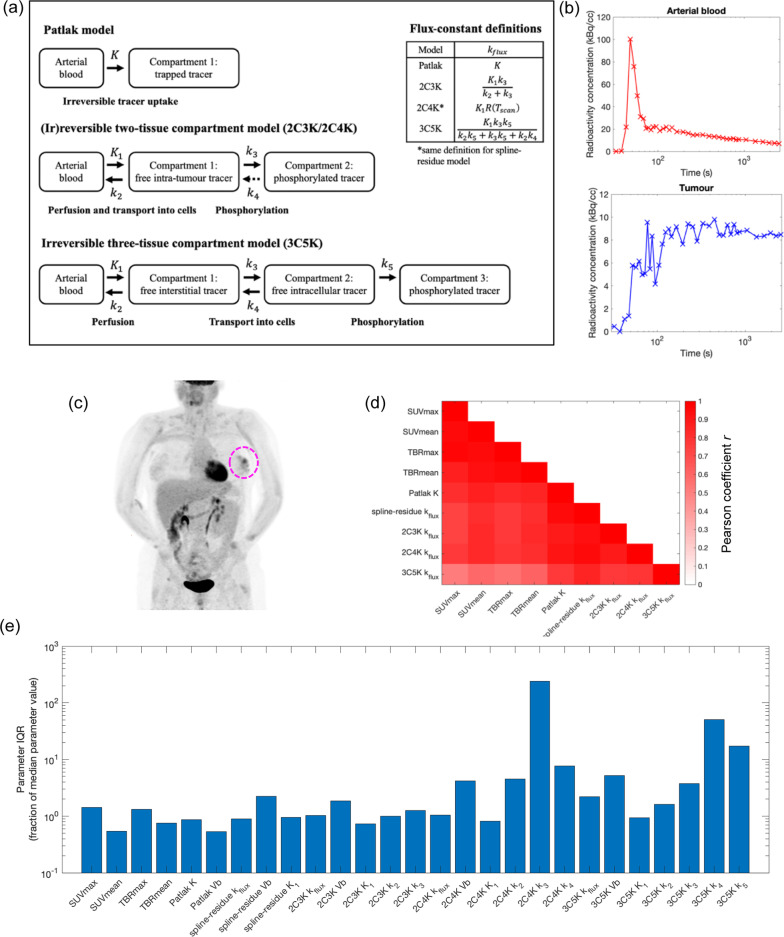
Fig. 1.
Overview of the FDG-PET imaging data and kinetic analysis. a Schematic diagrams of compartment models of FDG uptake. b Arterial and tumour time-activity-curves obtained from a patient’s dynamic FDG-PET scan. c Coronal maximum intensity projection through the patient’s static FDG-PET scan collected after dynamic imaging. The primary tumour lies at the centre of the dashed circle. Activity is also pronounced in the brain, heart kidneys and bladder. The static scan comprised data acquired at several bed positions whereas the dynamic scan comprised sequential images collected at one bed position. d Correlations between SUV, TBR and kinetic model flux-constants. e Interquartile ranges of model parameters

