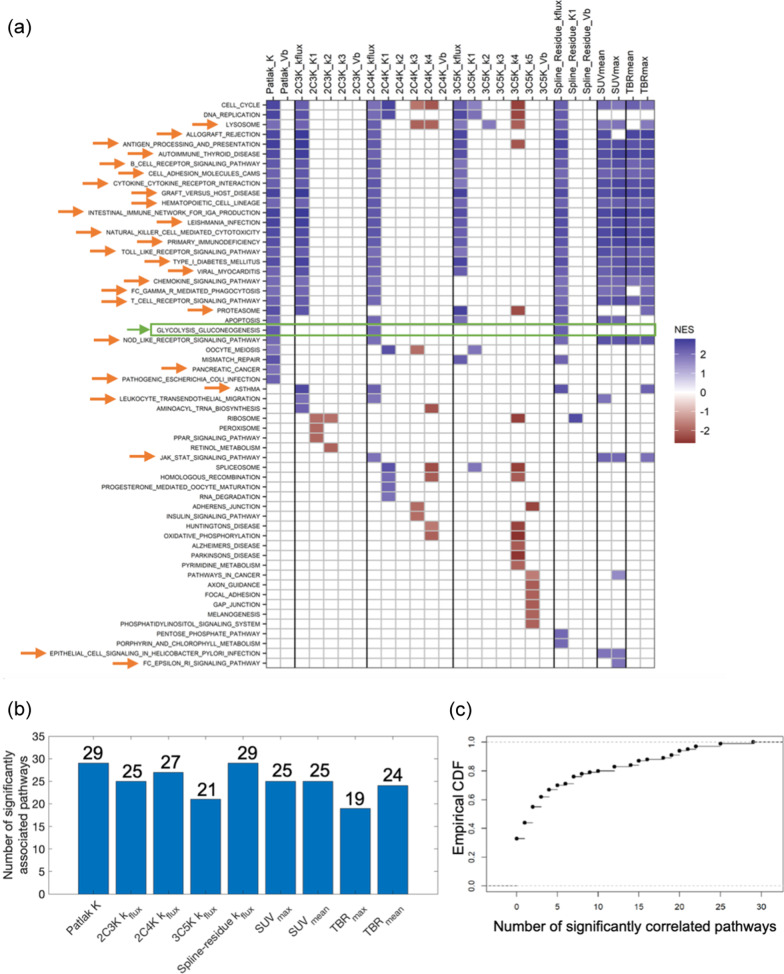
Fig. 2.
Pearson-based associations between KEGG pathways and image measures. a Plot showing pathways significantly associated with each imaging measure. The associated pathways are shaded by their normalised enrichment scores (NES) and GLYC-GLUC and immune-related pathways highlighted by green and orange arrows. b Numbers of pathways associated with model flux-constants and SUV and TBR measures. c Cumulative distribution function (CDF) showing numbers of pathways (false positives) associated with permuted SUVmax values in 100 synthetic datasets

