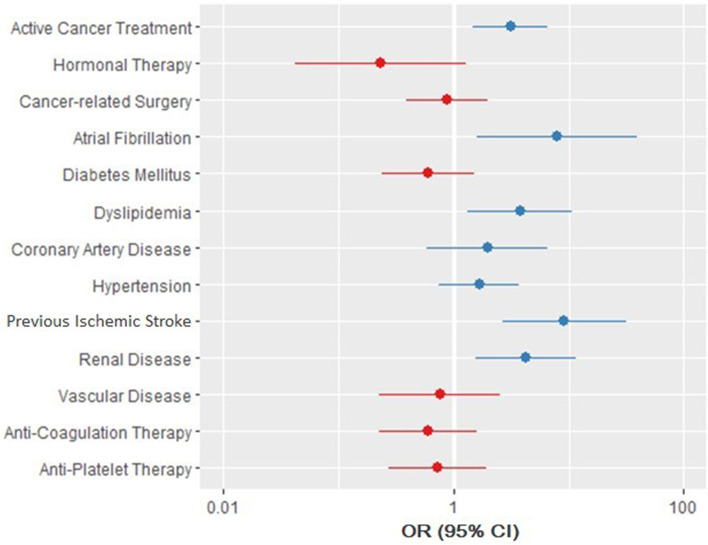
Fig. 1.
Forest Plot of Analysis of Multiple Clinical Variables and the Likelihood of stroke/TIA Occurring in Cancer Patients. Multivariate analysis was carried out using conditional logistic regression to study the effects of the clinical variables on the likelihood of having Stroke/TIA. The points represent the Odds Ratio, and the lines represent the 95% confidence interval. Points in blue represent an OR >1 indicating that cases with Stroke/TIA are more likely to have the corresponding clinical characteristic. Lines (CIs) which do not cross the null value of 1 represent statistical significance

