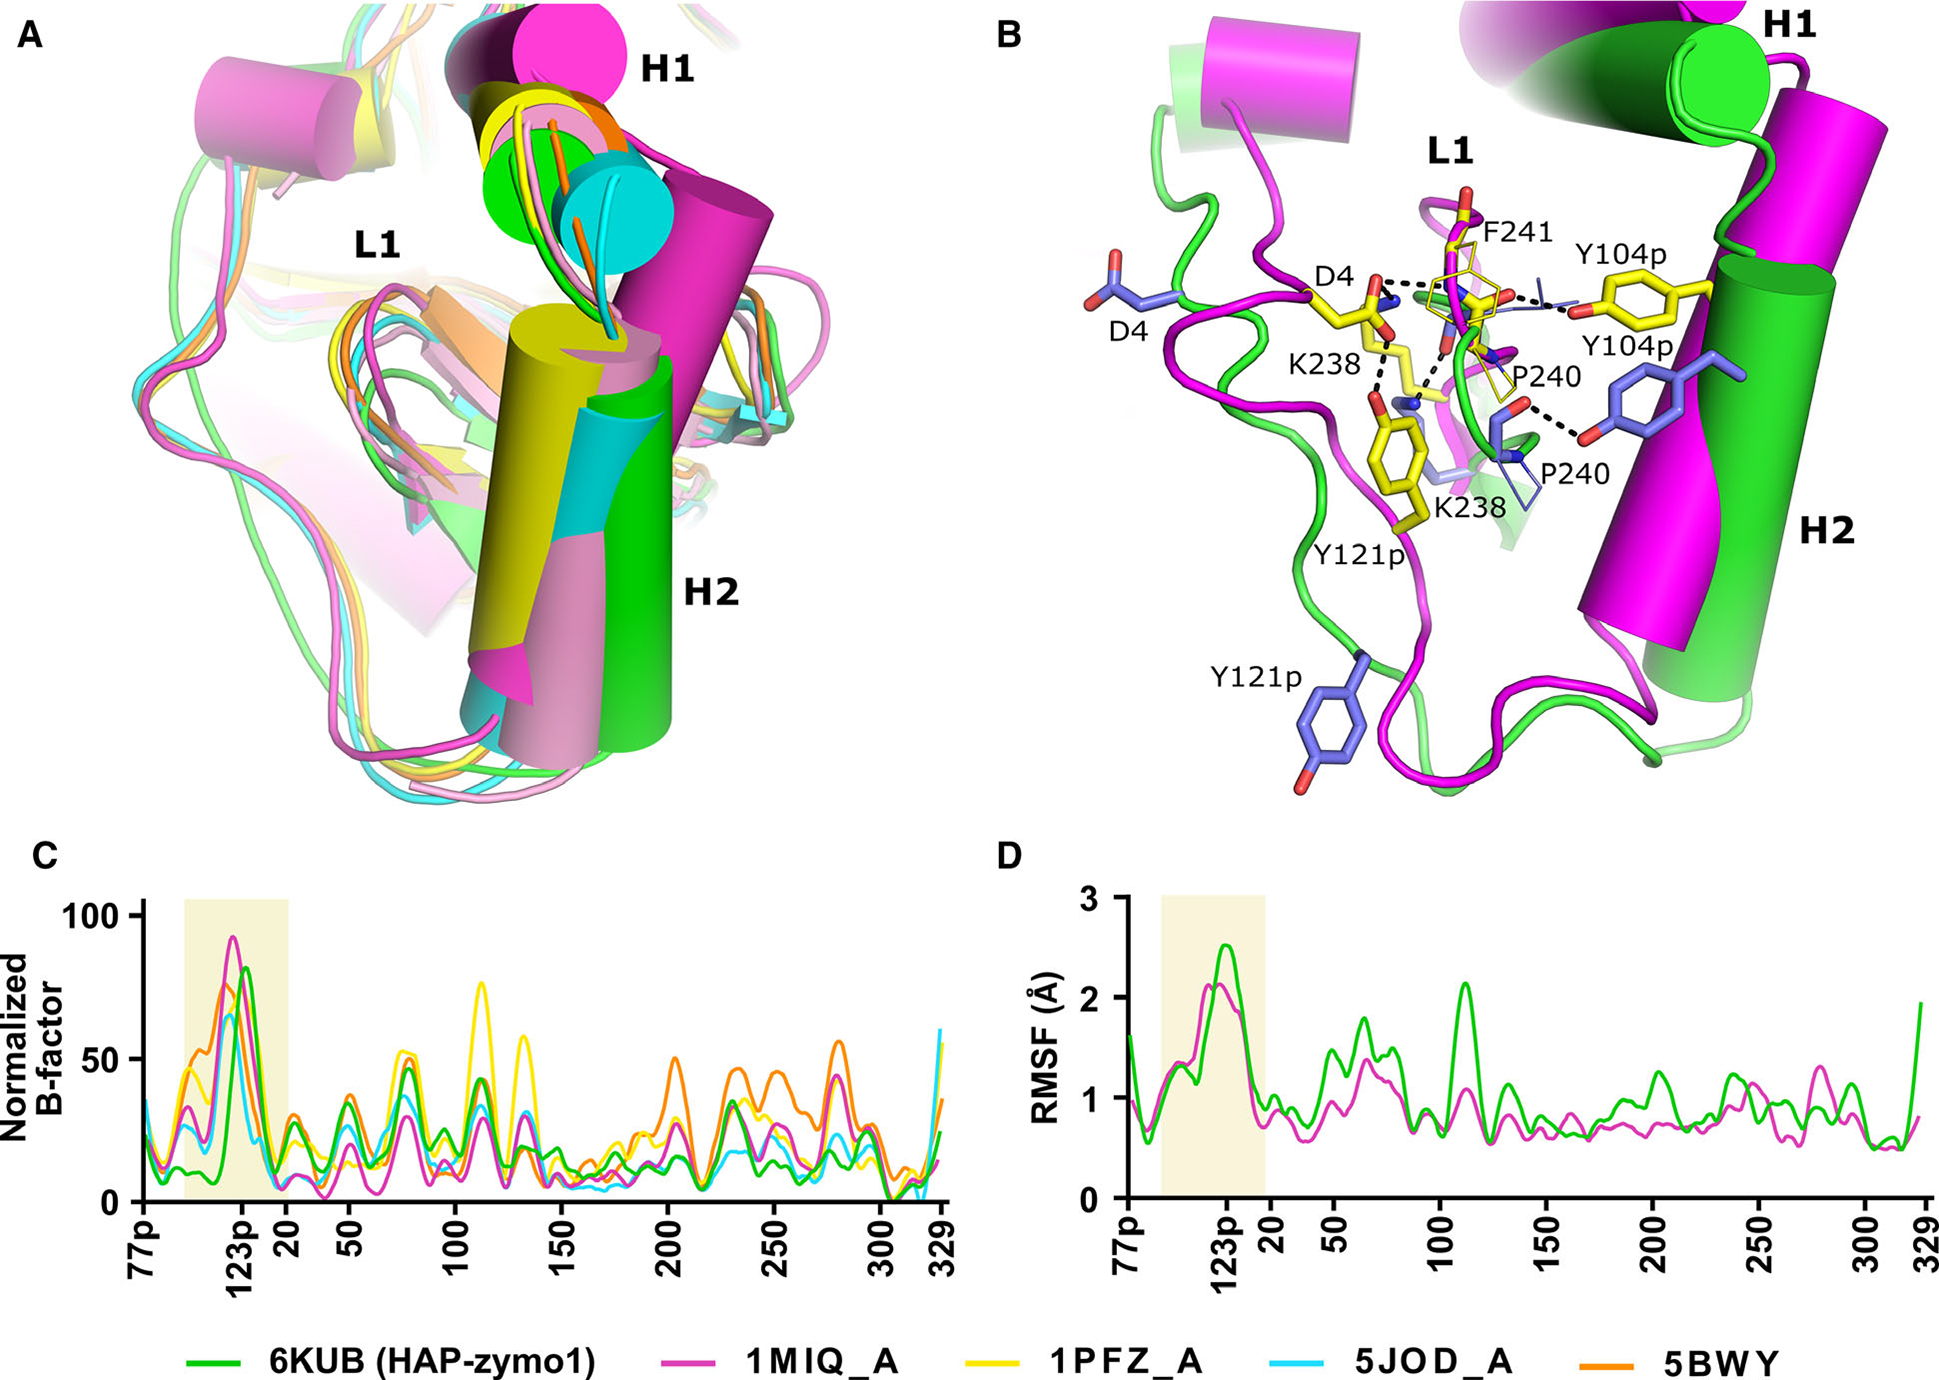
Fig. 6.

Comparison of the regions of flexibility in the structure of pro-tPMs. (A) Superposition of pro-tHAP (HAP-zymo1; 6KUB) in green, Pv-pro-tPM (1MIQ, chain A) in magenta, pro-tPMII (1PFZ, chain A) in yellow, pro-tPMII (1PFZ, chain C) in salmon pro-tPMIV (5JOD, chain A) in cyan, pro-tPMII (5BWY) in orange. (B) Interactions essential for stabilization of the Tyr-Asp loop of pro-mature region. Secondary structural elements of Pv-pro-tPM (1MIQ) and pro-tHAP (6KUB are shown in magenta and green, respectively. The side chains of residues of Pv-pro-tPM (1MIQ) and pro-tHAP (6KUB) are shown in yellow and blue, respectively. Important polar interactions are shown as black dotted lines. The protein structural representation has been generated with the PyMOL molecular graphics system (Schrödinger LLC, New York, NY, USA; version 2.3.2). (C) Normalized B-factors of the Cα atoms derived from the crystal structures of pro-tPMs; pro-tHAP (6KUB) in green, Pv-pro-tPM (1MIQ) in magenta, pro-tPMII (1PFZ) in yellow, pro-tPMIV (5JOD) in cyan, pro-tPMII (5BWY) in orange. (D) The R.M.S.F. of the Cα atoms obtained from the simulation of pro-tHAP (6KUB) in green and Pv-pro-tPM (1MIQ) in magenta.
