Abstract
Although deregulation of transfer RNA (tRNA) biogenesis promotes the translation of pro-tumorigenic mRNAs in cancers1,2, the mechanisms and consequences of tRNA deregulation in tumorigenesis are poorly understood. Here we use a CRISPR–Cas9 screen to focus on genes that have been implicated in tRNA biogenesis, and identify a mechanism by which altered valine tRNA biogenesis enhances mitochondrial bioenergetics in T cell acute lymphoblastic leukaemia (T-ALL). Expression of valine aminoacyl tRNA synthetase is transcriptionally upregulated by NOTCH1, a key oncogene in T-ALL, underlining a role for oncogenic transcriptional programs in coordinating tRNA supply and demand. Limiting valine bioavailability through restriction of dietary valine intake disrupted this balance in mice, resulting in decreased leukaemic burden and increased survival in vivo. Mechanistically, valine restriction reduced translation rates of mRNAs that encode subunits of mitochondrial complex I, leading to defective assembly of complex I and impaired oxidative phosphorylation. Finally, a genome-wide CRISPR–Cas9 loss-of-function screen in differential valine conditions identified several genes, including SLC7A5 and BCL2, whose genetic ablation or pharmacological inhibition synergized with valine restriction to reduce T-ALL growth. Our findings identify tRNA deregulation as a critical adaptation in the pathogenesis of T-ALL and provide a molecular basis for the use of dietary approaches to target tRNA biogenesis in blood malignancies.
Accumulating evidence suggests that reprogramming of mRNA translation can drive protumorigenic programs. Translation initiation, the first and often the rate-limiting step in mRNA translation, is commonly hijacked by oncogenic signalling pathways3,4. However, recent findings have highlighted altered tRNA biogenesis and resultant changes in codon usage as an additional regulatory layer in the translation of cancer genomes1,2,5.
Valine tRNA biogenesis is altered in T-ALL
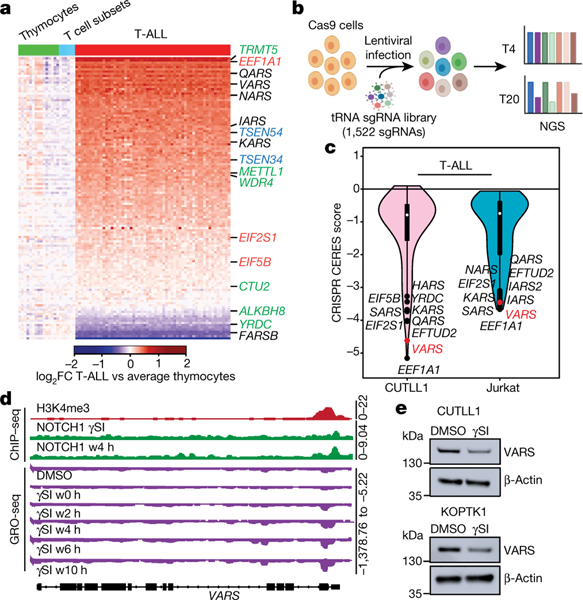
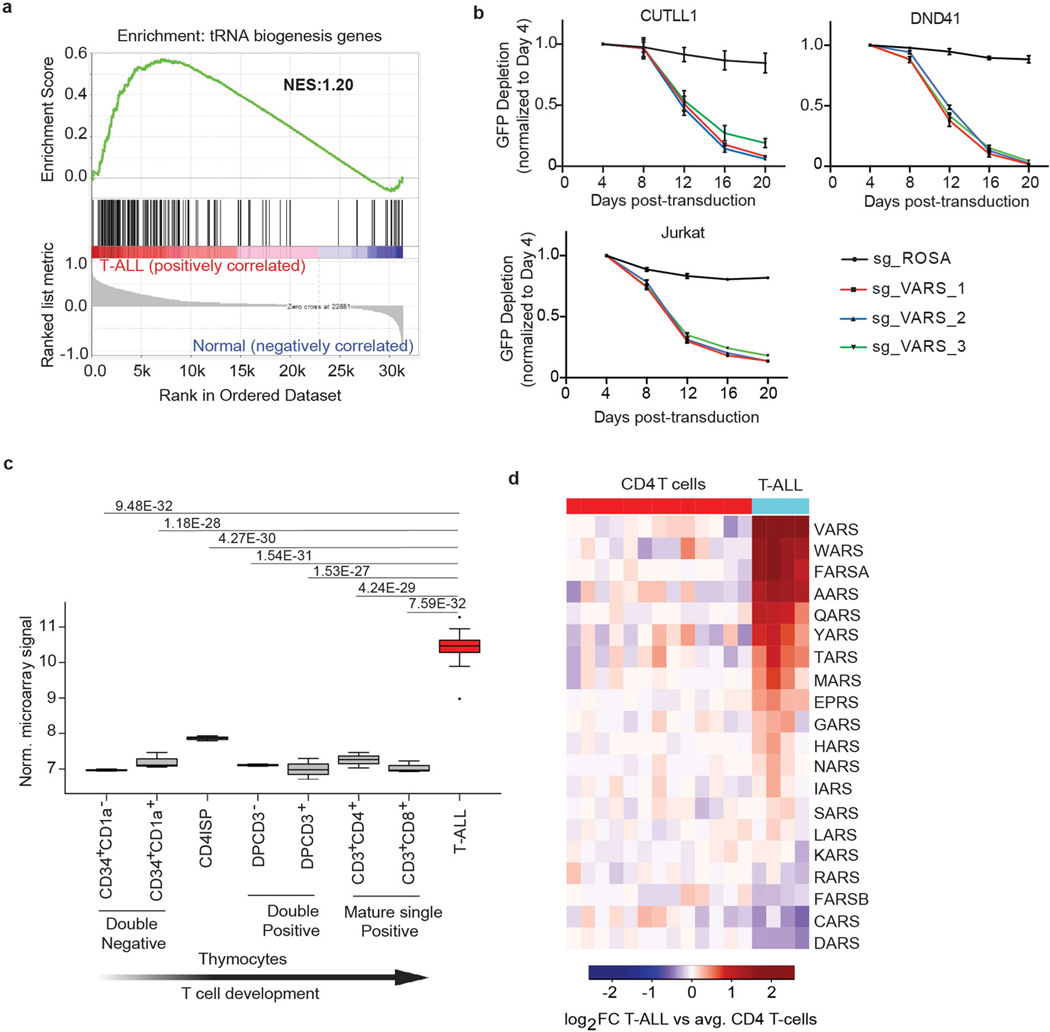
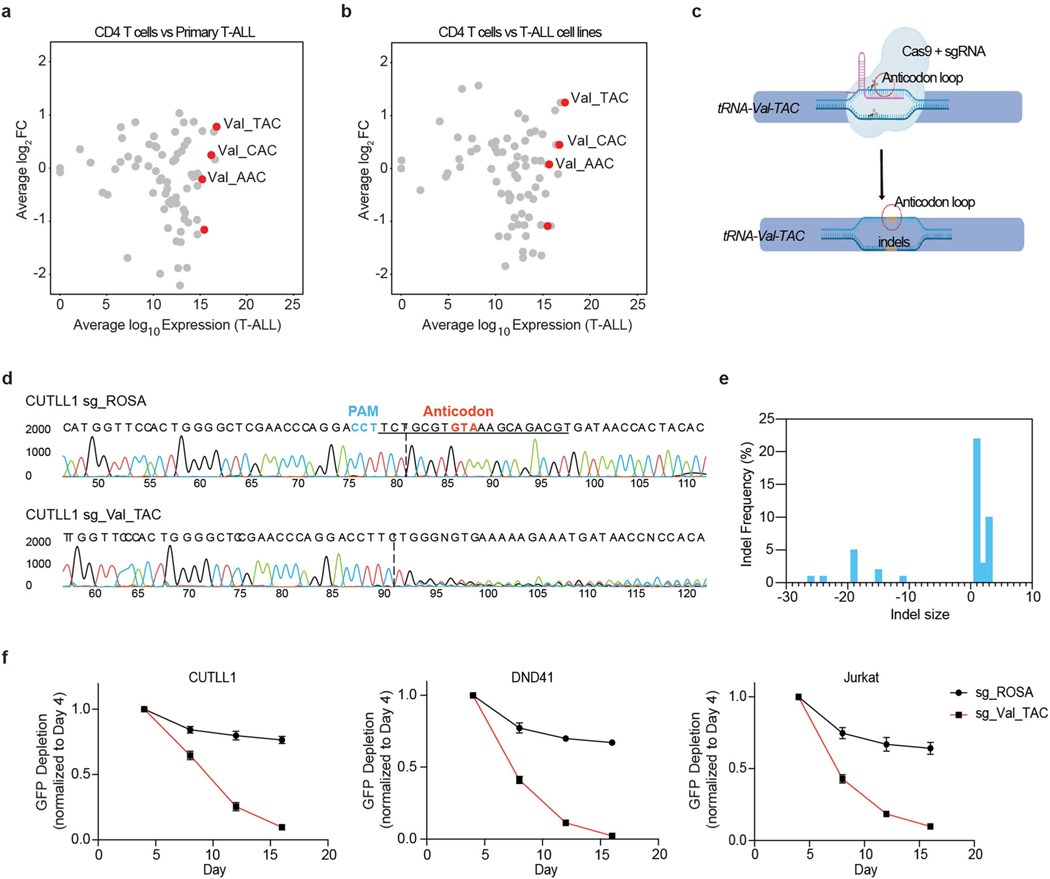
To determine whether tRNA biogenesis is deregulated in blood cancers, we focused on T-ALL, a disease that afflicts both children and adults and currently has no FDA-approved targeted therapies6. Analysis of gene expression datasets from primary T-ALL samples, thymocytes and mature T cell subsets (as controls)7 revealed significant expression changes in T-ALL samples among genes involved in tRNA biogenesis (Fig. 1a, Extended Data Fig. 1a). Furthermore, a pooled CRISPR–Cas9 loss-of-function negative-selection screen targeting genes involved in tRNA biogenesis8 identified strong depletion of single guide RNAs (sgRNAs) targeting VARS, encoding aminoacyl tRNA synthetase, which charges valine tRNAs with valine (Fig. 1b, c, Extended Data Fig. 1b) in T-ALL cell lines. Consistent with this observation, VARS mRNA was significantly upregulated in T-ALL samples relative to control subsets (Extended Data Fig. 1c, d). In addition, tRNA expression profiling2 in primary T-ALL samples showed that valine tRNAs were consistently highly expressed in T-ALL samples (Extended Data Fig. 2a, b). Specifically, tRNA-Val-TAC expression was upregulated in T-ALL relative to T cells. tRNA-Val-TAC was previously classified as a proliferative tRNA induced in cells undergoing rapid cell division, including transformed cells9. To functionally validate the essentiality of tRNA-Val-TAC in T-ALL, we used CRISPR–Cas9 targeting of the tRNA anti-codon loop to induce insertions and deletions (indels) that disrupt the codon–anticodon pairing of tRNAs10 (Extended Data Fig. 2c). With an sgRNA that targets four of the five tRNA-Val-TAC isodecoders, we induced indels within the anti-codon loop (Extended Data Fig. 2d, e). Phenotypically, these genome-editing events reduced cellular fitness in multiple T-ALL cell lines (Extended Data Fig. 2f).
Fig. 1 |. Valine tRNA biogenesis is upregulated by NOTCH1 in T-ALL.
a, Heatmap of changes in mRNA expression of genes involved in Trna biogenesis between cells from patients with T-ALL (n = 57) and thymocyte subsets (n = 21; 7 thymocyte and mature T cell subsets derived from 3 donors) (green, tRNA-modifying genes; black, aminoacyl tRNA synthetases; red, translational factors that bind to tRNAs; blue, genes that regulate tRNA splicing). log2fold-change (FC) expression between T-ALL and average thymocytes. b, Schematic of the CRISPR–Cas9 screen for genes involved in tRNA biogenesis (created with Biorender.com). NGS, next-generation sequencing. c, Violin plot of CERES dependency scores of the CRISPR–Cas9 screen (the box plot values for the CUTLL1 cell line: minimum −5.16, maximum 0.10, 25% quartile −1.57, 50% quartile −0.79, 75% quartile −0.47; for the Jurkat cell line: minimum −3.66, maximum −0.06, 25% quartile −1.99, 50% quartile −0.74, 75% quartile −0.38). The top ten depleted genes in each cell line are highlighted. d, Snapshots of H3K4me3 and NOTCH1 chromatin immunoprecipitation followed by sequencing (ChIP–seq) on the VARS promoter. GRO-seq (below; negative strand) upon DMSO, γSI treatment and release after drug wash out as counts per million. w0 h, wash out after 0 h. e, Protein levels of VARS and actin (same gel) after treatment with DMSO or γSI for 72 h (representative of n = 2 independent experiments).
NOTCH1 regulates valine tRNA biogenesis
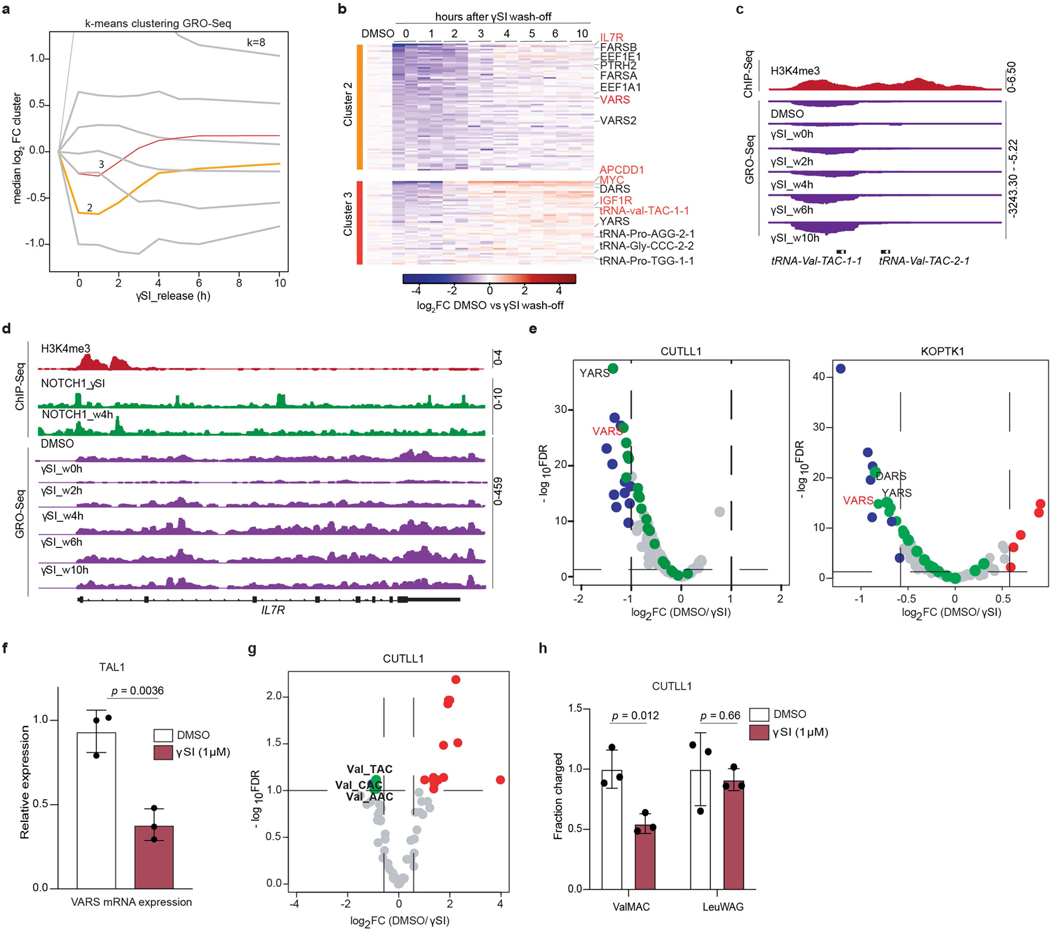
Activating mutations in NOTCH1 underpin the majority of cases of T-ALL11. Aberrant NOTCH1 signalling can upregulate genes involved in tRNA biogenesis and protein synthesis12. To understand the dynamics of NOTCH1-dependent transcription, we performed global run-on sequencing (GRO-seq)13 to measure nascent transcription following inhibition of NOTCH1 with γ-secretase inhibitor (γSI) and subsequent inhibitor ‘wash off’. We utilized this dataset to identify different clusters of γSI-responding genes by applying k-means clustering. Specifically, two distinct clusters (2 and 3) decreased in expression following γSI treatment and quickly re-established expression after inhibitor wash off (Extended Data Fig. 3a). These clusters included known NOTCH1 target genes, such as MYC, IL7R and IGF1R12,14–16 (Extended Data Fig. 3b). Clusters 2 and 3 were also enriched for several tRNA genes and protein-coding genes involved in tRNA biogenesis. Specifically, nascent transcripts of VARS and tRNA-Val-TAC-1–1 showed strong downregulation following inhibition of NOTCH1 and re-established expression to the level of vehicle-treated cells within 4 h of inhibitor wash off (Fig. 1d, Extended Data Fig. 3c), which was comparable to that seen for IL7R (Extended Data Fig. 3d). In addition, NOTCH1 chromatin immunoprecipitation followed by sequencing analysis identified γSI-sensitive NOTCH1 binding to the VARS promoter (Fig. 1d). RNA sequencing further corroborated that multiple genes involved in tRNA biogenesis were sensitive to NOTCH1 inhibition, with VARS among the top significantly downregulated transcripts (Extended Data Fig. 3e, f). Concurrent with this observation, VARS protein levels also decreased on NOTCH1 inhibition (Fig. 1e). In addition, γSI treatment decreased the levels of total and aminoacylated valine tRNAs (Extended Data Fig. 3g, h). Overall, these data suggest that oncogenic NOTCH1 signalling has a direct role in the transcriptional activation of genes involved in valine tRNA biogenesis in T-ALL.
Valine deprivation reduces leukaemic burden
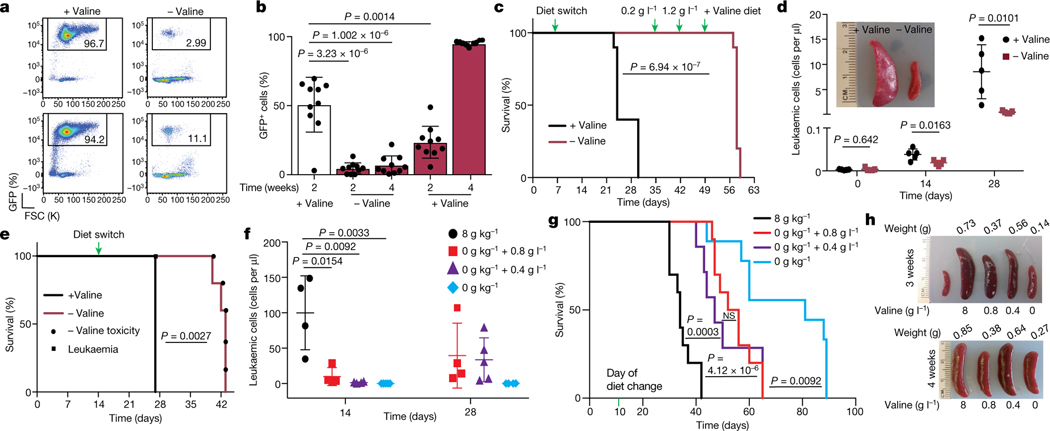
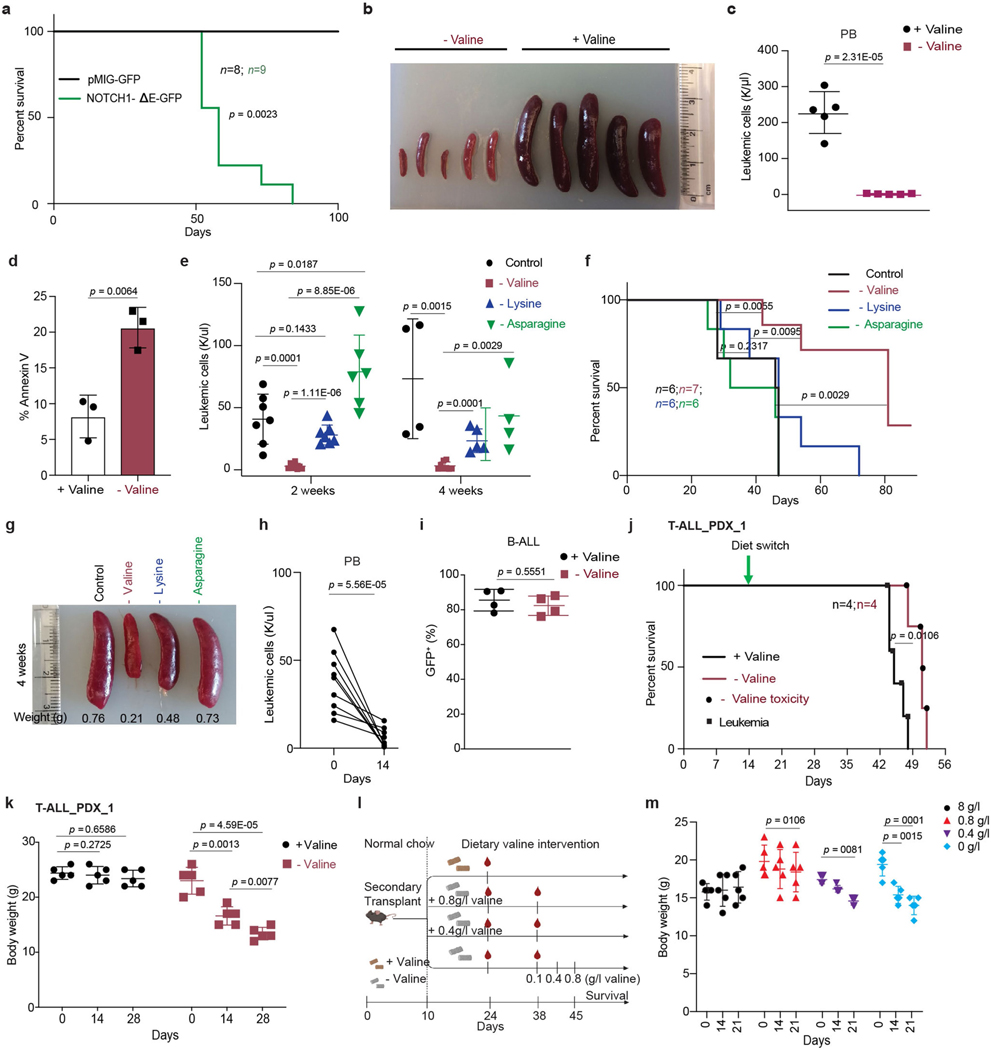
Upregulation of valine tRNA biogenesis suggested restricted availability of a ready-to-translate pool of valine tRNAs in T-ALL5. As valine is an essential amino acid that must be substituted through diet17, we hypothesized that dietary depletion of valine could further disrupt this balance, potentially reducing the survival of T-ALL. To test this, we used a preclinical T-ALL mouse model driven by an oncogenic form of NOTCH1, NOTCH1-ΔE, that is constitutively cleaved in a ligand-independent manner18. Mice transplanted with NOTCH1-ΔE-GFP Kit-enriched haematopoietic stem and progenitor cells succumbed to overt T-ALL, as previously reported19 (Extended Data Fig. 4a). Splenic blasts were then used for secondary transplantation. Secondary-transplanted mice fed a valine-deficient diet had a significant reduction in leukaemic cell numbers in peripheral blood and infiltration in the spleen compared with mice fed a control valine-proficient diet (8 g/kg; 0.8% valine) (Fig. 2a, Extended Data Fig. 4b, c). Furthermore, valine deprivation resulted in increased apoptosis of the leukaemic blasts (Extended Data Fig. 4d). This effect on leukaemic burden was more pronounced for valine than for dietary deprivation of lysine20 or asparagine21 (Extended Data Fig. 4e–g). Although L-asparaginase is frequently used in the treatment of ALL, dietary deprivation of L-asparagine had no significant effect in T-ALL progression, probably due to the difference in the kinetics of depleting circulating asparagine between the two methods21,22. Deprivation of valine also significantly decreased tumour burden in mice with high leukaemic blast counts (more than 60% GFP+ cells in peripheral blood) at the start of the dietary regimen (Extended Data Fig. 4h). Finally, valine deprivation did not affect tumour progression of a BCR–ABL fusion B-ALL tumour model (Extended Data Fig. 4i), suggesting specificity for T-ALL. However, gradual reintroduction of valine in drinking water23 coincided with GFP+ disease re-emergence in T-ALL, although it still significantly increased overall survival (Fig. 2b, c). Next, to investigate whether valine dependency is conserved in human T-ALL, we performed dietary valine deprivation in immunodeficient mice transplanted with patient-derived T-ALL primary cells, carrying NOTCH1 mutations. Valine deprivation led to a significant reduction in leukaemic burden, splenomegaly and increased survival in T-ALL xenografts, despite the variation in the extent of the response between the patient-derived xenografts utilized. (Fig. 2d, e, Extended Data Fig. 4j). Collectively, the presented experiments demonstrate that human and mouse T-ALL is sensitive to dietary levels of valine.
Fig. 2 |. Dietary valine restriction reduces leukaemic burden and increases survival.
a, Representative FACS plots of GFP+ frequency in peripheral blood of mice transplanted with NOTCH-ΔE–GFP+ cells and fed either a control diet (+valine) or a valine-deficient diet (−valine). b, Percentage of GFP+ cells in peripheral blood of transplanted mice fed either a control diet (n = 10) or a valine-deficient diet (n = 10) followed by gradual valine reintroduction (mean ± s.d.; two-sided unpaired t-test). c, Kaplan–Meier survival graph of mice represented in b (log-rank test; two-sided). d, Leukaemic burden in peripheral blood in mice transplanted with patient-derived xenograft model 1 of T-ALL fed either a control diet or a valine-deficient diet (n = 5; mean ± s.d.; two-sided unpaired t-test) along with representative spleen images. e, Kaplan–Meier survival graph of mice transplanted with patient-derived xenograft 2 and fed a control diet or a valine-deficient diet (n = 5 each condition) (log-rank test; two-sided). Death owing to leukaemia or toxicity of valine deprivation is highlighted. f, Absolute leukaemic burden in peripheral blood from mice fed different dietary valine diets: 8 g kg−1 valine (n = 4), 0 g kg−1 valine (n = 5), 0 g kg−1 valine substituted with either 0.8 g l−1 valine (n = 5) or 0.4 g l−1 valine (n = 5) (mean ± s.d.; two-sided unpaired t-test). g, Kaplan–Meier survival graph of mice fed different levels of dietary valine (8 g kg−1 (n = 10); 0 g kg−1 (n = 10); 0 g kg−1 substituted with 0.8 g l−1 valine (n = 7) or 0.4 g l−1 valine (n = 9) (log-rank test; two-sided). NS, not significant. h, Representative images of the spleen from mice fed different levels of dietary valine.
Valine restriction overcomes toxicity
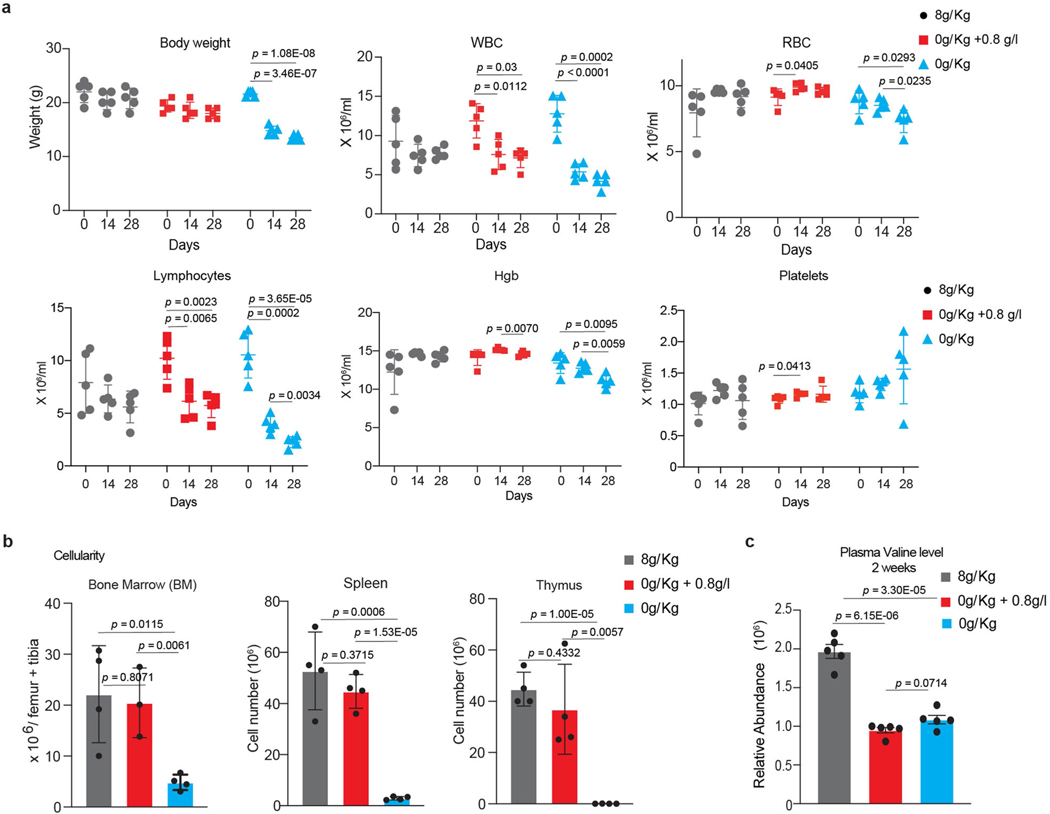
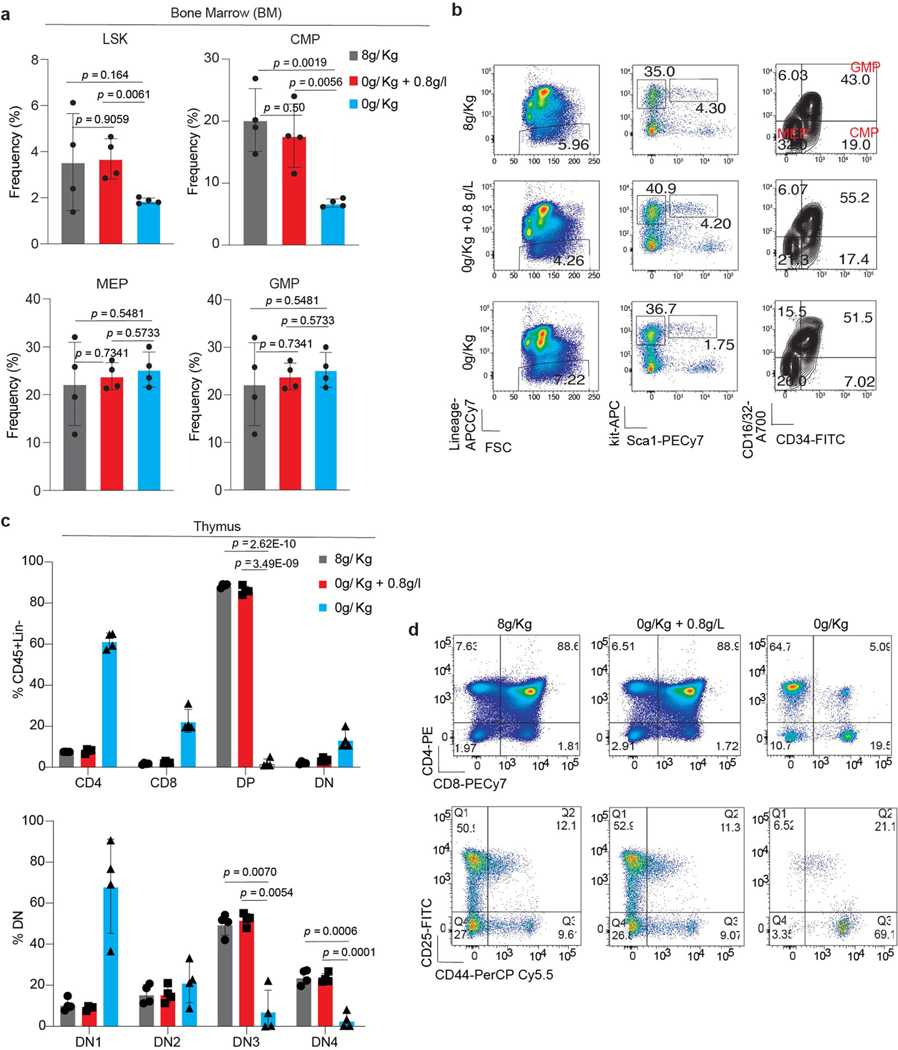
Prolonged dietary deprivation of valine was associated with weight loss and impaired haematopoiesis23 (Extended Data Fig. 4k). Titrating physiological levels of branched chain amino acids (BCAAs) can affect metabolic health24–26. Hence, we sought to determine whether dietary valine could be lowered to levels that can affect T-ALL progression without the adverse effects of total valine deprivation. To address this, secondary-transplanted mice were fed a control diet, a valine-deficient diet or a valine-deficient diet supplemented with 0.8 g l−1 (0.08%) or 0.4 g l−1 (0.04%) valine in drinking water (Extended Data Fig. 4l). We observed significantly reduced circulating tumour burden and increased survival in mice fed intermediate levels of valine (Fig. 2f–h). For animals totally deprived of valine, the mice were fed a valine-deficient diet for 4 weeks followed by gradual reintroduction of valine to 0.8 g l−1. Although this dietary regimen gave the highest survival advantage (Fig. 2g), the mice presented with significant weight loss during the valine deprivation phase (Extended Data Fig. 4m). Conversely, restriction to 0.8 g l−1 valine showed potential as an optimal dose with no overt loss of body weight (Extended Data Fig. 4m) and significantly prolonged survival (Fig. 2g). To further assess the effects of this intermediate valine restriction on overall haematopoiesis, we quantified various haematopoietic cell types in mice fed 0.8 g l−1 valine for a period of 4 weeks. Valine restriction to 0.8 g l−1 altered neither red blood cell and platelet counts (Extended Data Fig. 5a) nor the cellularity of the bone marrow, spleen and thymus (Extended Data Fig. 5b). Quantification of plasma valine levels confirmed approximately 50% reduction following 2 weeks of differential valine diets (Extended Data Fig. 5c). In addition, analysis of the bone marrow and thymus revealed normal haematopoiesis and T cell development, respectively, in mice fed a valine-restricted diet (Extended Data Fig. 6a–d). Overall, these experiments provide evidence that controlled dietary valine restriction can delay the progression of leukaemia without the adverse effects of total valine deprivation.
Mapping genetic interactions with valine restriction
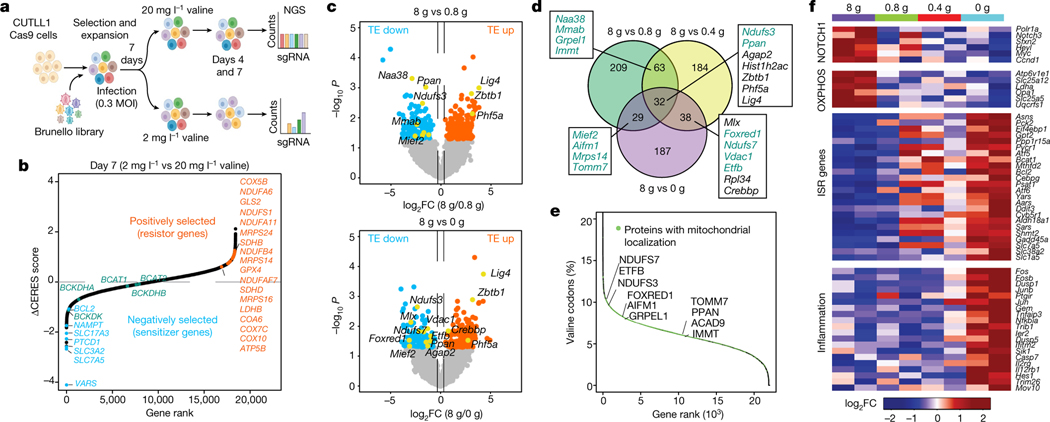
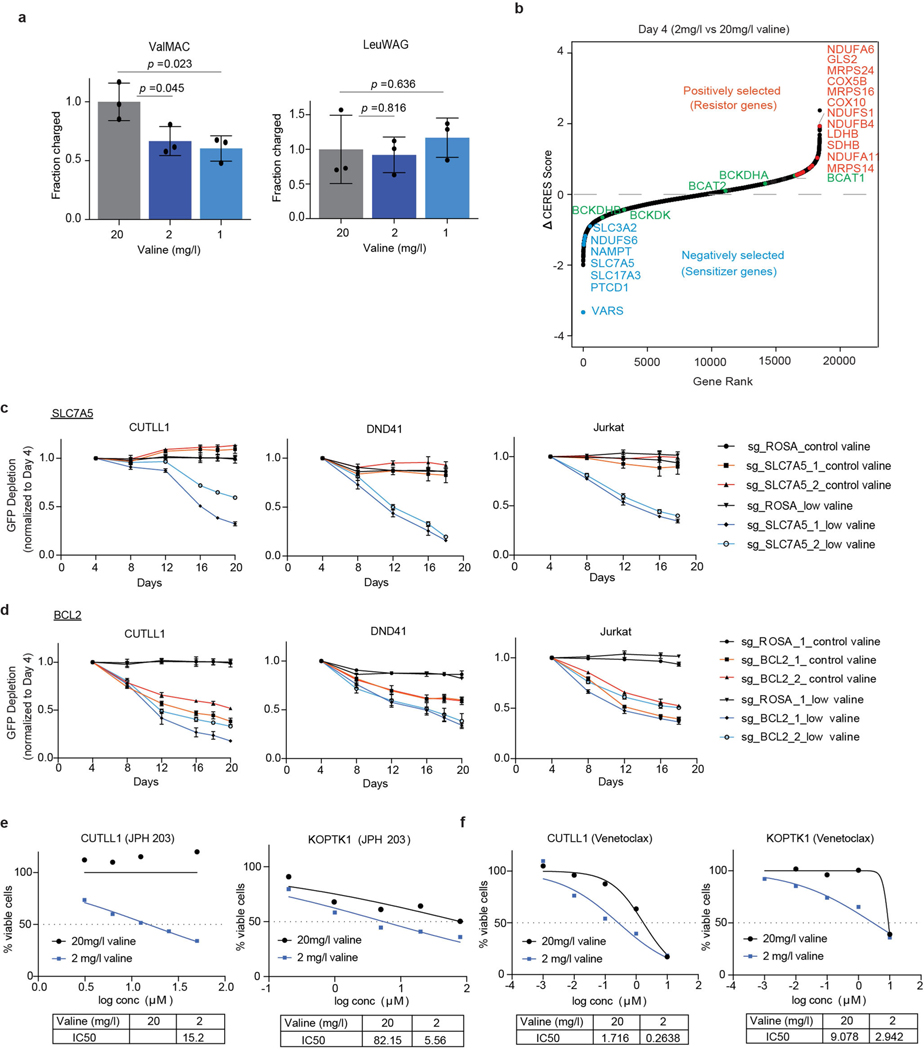
To understand the precise mechanistic underpinnings of valine dependency in T-ALL, we modelled valine restriction in vitro and performed a genome-wide CRISPR–Cas9 loss-of-function screen to systematically map the genetic interactions that impinge on valine restriction. Limitation of valine in culture medium from 20 mg l−1 to 2 mg l−1 or 1 mg l−1 decreased the levels of aminoacylated valine tRNAs (Extended Data Fig. 7a). A genome-wide CRISPR screen identified VARS as the top negatively selected gene in the low-valine (20 mg l−1) condition throughout the time course (Fig. 3a, b, Extended Data Fig. 7b). SLC7A5 (encoding solute carrier family 7 member 5) and SLC3A2 (encoding solute carrier family 3 member 2), genes that constitute the heterodimeric system L-transporter to mediate transport of BCAAs27, were also among the top negatively selected genes in the valine-restricted condition. However, we did not see negative selection of sgRNAs targeting BCAA transaminases (BCAT1 and BCAT2), whereas sgRNAs targeting BCKDK, which encodes the kinase that blocks BCAA catabolism through inhibitory phosphorylation of the branched chain α-keto acid dehydrogenase (BCKDH) complex28, were depleted on valine restriction. In addition, loss of glutaminase 2 (encoded by GLS2), which catalyses the hydrolysis of glutamine to glutamate29, promoted cellular growth on valine restriction (Fig. 3b, Extended Data Fig. 7b). Increased intracellular glutamine levels on loss of GLS2 could be used by the bidirectional SLC7A5–SLC3A2 transporter complex for the simultaneous efflux of glutamine and import of valine30. These positive and negative genetic interactions affirm the requirement to maintain high intracellular levels of valine in T-ALL cells. Overexpression of SLC7A5 has been reported to be critical for T-ALL growth and survival31. Furthermore, VARS being the most negatively enriched gene in the low-valine condition validates our hypothesis that intracellular valine in T-ALL is primarily used in protein synthesis and is not metabolized for anaplerosis in the tricarboxylic acid cycle. We validated a few of our top negatively selected genes, including SLC7A5 and BCL2, with individual sgRNAs (Extended Data Fig. 7c, d). Furthermore, pharmacological inhibition of SLC7A5 and BCL-2 with the small-molecule inhibitors JPH-203 (ref.32) and ABT-199 (also known as Venetoclax (Selleck))33, respectively, synergized with valine limitation (Extended Data Fig. 7e, f), demonstrating that targeted therapies can be effectively coordinated with dietary restriction of valine to enhance the efficacy of dietary valine modulation in reducing T-ALL cell fitness.
Fig. 3 |. Dietary valine restriction reduces translation of mRNAs involved in the mitochondrial ETC.
a, Schematic of the genome-wide CRISPR–Cas9 loss-of-function screen in different valine media (created with Biorender.com). MOI, multiplicity of infection. b, Gene ranks plotted on the basis of the ΔCERES dependency score between low and standard valine. Negatively selected genes (blue), positively selected genes (red) and BCAA metabolism genes (green) are highlighted. c, Volcano plots of Δ translational efficiency (TE) in NOTCH-ΔE–GFP+ cells isolated from mice fed different levels of dietary valine (n = 2 for each condition) (P < 0.05 and log2FC > 0.58 or log2FC < −0.58). d, Venn diagram showing overlap of the differentially translated mRNAs across different valine diets (green, proteins with reported mitochondrial localization based on MitoCarta 2.0; black, proteins with no reported mitochondrial localization). e, Occurrence of valine codons (%) in the human genome sorted high to low. Mitochondrial genes are indicated in green. f, Heatmap representing changes in total RNA expression of NOTCH-ΔE–GFP+ cells from mice fed different levels of dietary valine (n = 2 for each condition). log2FC of FPKM of mRNAs from mice fed reduced levels of valine relative to mice fed a control diet. ISR, integrated stress response; OXPHOS, oxidative phosphorylation; FPKM, fragments per kilobase of transcript per million mapped reads.
Valine levels affect translation of ETC mRNAs
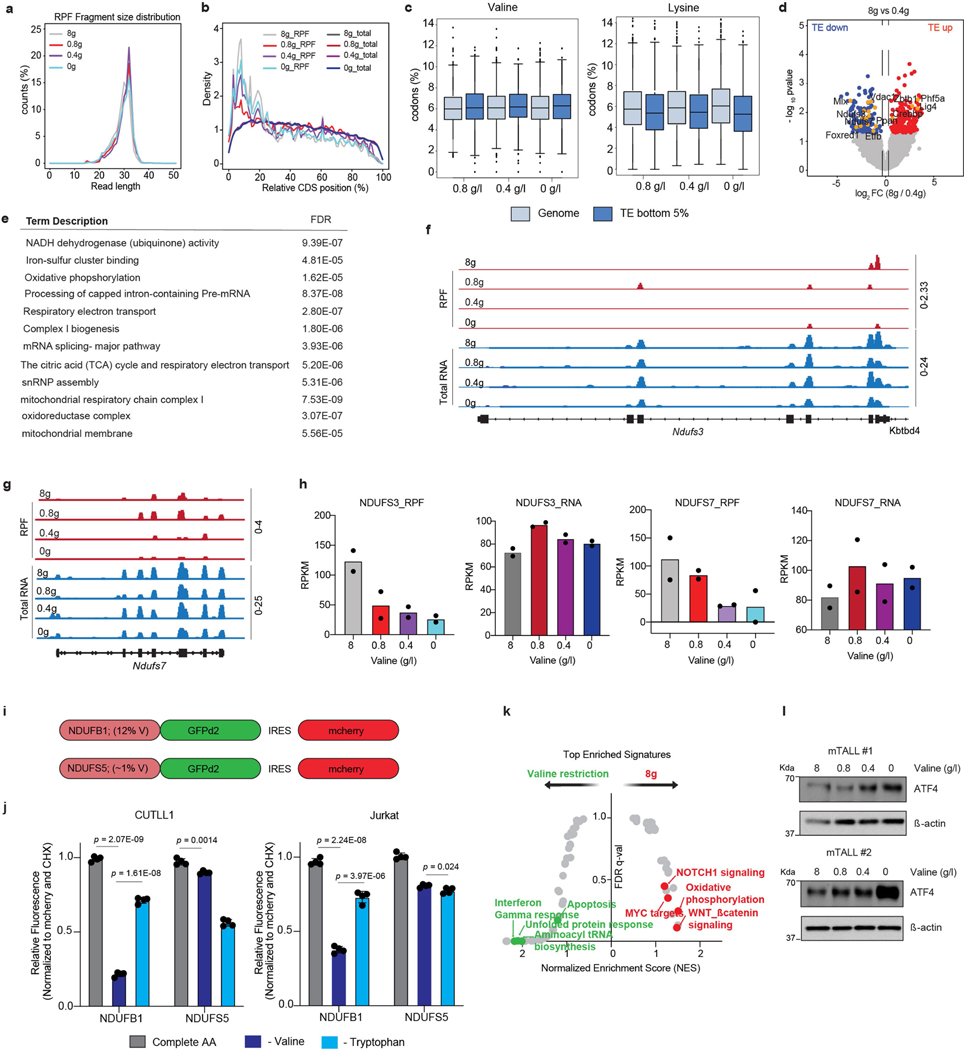
Next, to understand the regulatory changes that underlie the effects of dietary valine restriction in T-ALL, we assessed changes in active translation by ribosome profiling in the splenic blasts sorted from mice fed different valine diets. The length and distribution within coding sequences of ribosome-protected fragments compared with total mRNAs assured the quality of the ribosome-profiling dataset (Extended Data Fig. 8a, b). Global codon enrichment analysis identified increased valine codons among mRNAs translationally downregulated on dietary valine restriction (Extended Data Fig. 8c). We identified 162 differentially translated mRNAs between control and at least two of the valine-restricted conditions (P < 0.05) (Fig. 3c, d, Extended Data Fig. 8d). STRING network analysis identified enrichment in processes related to the electron transport chain (ETC) including NADH dehydrogenase (ubiquinone) activity, iron-sulfur clustering and mitochondrial complex I biogenesis (Extended Data Fig. 8e), suggesting that valine restriction can deregulate mitochondrial proteostasis. Analysis of the annotated human proteome revealed that mitochondrial proteins were generally enriched for valine codons along with several of those that were translationally downregulated in valine-restricted conditions (Fig. 3e). Specifically, mRNAs encoding NDUFS3 and NDUFS7, the core subunits of ETC complex I, displayed significantly reduced translation in valine-restricted conditions (Extended Data Fig. 8f–h). To further support our conclusions that translation of mRNAs with high valine content is more sensitive to valine deprivation, we generated reporters expressing destabilized GFP (GFPd2; approximately 2-h half-life) in fusion with either NDUFB1 (12% valine) or NDUFS5 (approximately 1% valine), which are proteins that are part of ETC complex I and have high and low valine content, respectively. We found that expression of the NDUFB1–GFPd2 reporter was significantly more sensitive to valine deprivation than that of the NDUFS5–GFPd2 reporter. This effect was specific to deprivation of valine, as deprivation of tryptophan did not result in similar differences (Extended Data Fig. 8i, j). At the transcriptional level, valine restriction was associated with downregulation of genes that regulate growth and proliferation induced by NOTCH1, MYC and β-catenin signalling. Conversely, genes related to apoptosis, inflammation and the unfolded protein response, which are characteristic of the ATF4-dependent integrated stress response34, were upregulated (Fig. 3f, Extended Data Fig. 8k, l). Notably, transcripts of SLC7A5 and BCL2, candidates whose loss impaired cell fitness in the valine-restricted condition, were significantly upregulated upon valine restriction (Fig. 3f), suggesting that upregulated expression of SLC7A5 and BCL-2 is a potential mechanism of resistance to valine restriction.
Valine bioavailability regulates complex I
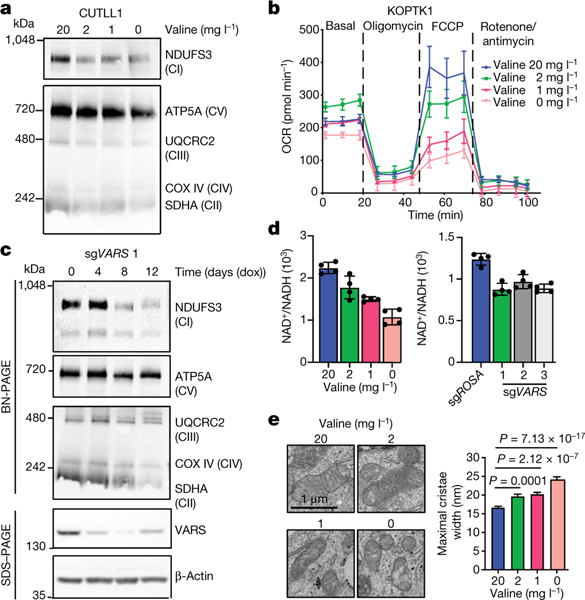
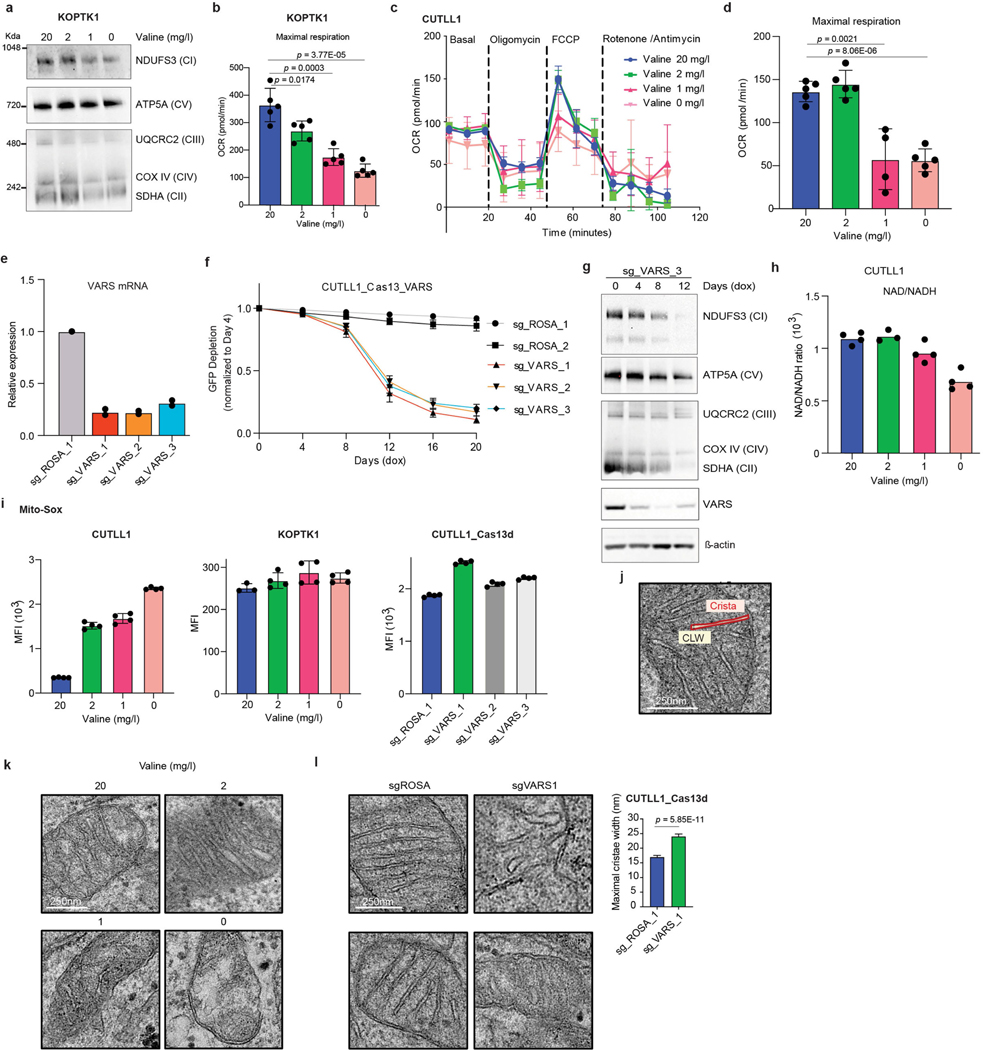
To characterize the functional consequences of reduced translation of mRNAs encoding ETC proteins, we performed blue native-PAGE and immunoblot analysis to evaluate the assembly profile of the ETC complexes upon valine restriction. Culturing T-ALL cell lines in valine-limited medium decreased the levels of ETC complexes with a strong reduction specifically in the levels of fully assembled complex I (Fig. 4a, Extended Data Fig. 9a). Reduced complex I formation was also associated with defective mitochondrial function, as measured by a reduced oxygen consumption rate with a strong reduction in the maximal respiration capacity on valine limitation (Fig. 4b, Extended Data Fig. 9b–d). Type VI CRISPR–Cas13d targeted knockdown of VARS mRNA also resulted in reduced complex I assembly, which preceded the loss of fitness observed following VARS knockdown (Fig. 4c, Extended Data Fig. 9e–g). Complex I misassembly was further validated with defective complex I activity, characterized by a decreased NAD+/NADH ratio and increased production of mitochondria-derived reactive oxygen species upon valine restriction and VARS knockdown (Fig. 4d, Extended Data Fig. 9h, i). Given that the respiratory chain complexes reside in the invaginations of the inner mitochondrial membrane, known as cristae (Extended Data Fig. 9j), we sought to closely examine the ultrastructure of mitochondria following valine restriction and VARS knockdown using electron microscopy-based morphometric analysis. Both valine restriction and VARS knockdown resulted in an increase in the width of the crista lumen and disorganization (Fig. 4e, Extended Data Fig. 9k, l), indicating structural abnormalities that reflect defects in respiration35. Collectively, these results provide evidence that targeting valine tRNA biogenesis either through valine restriction or knockdown of VARS expression leads to defects in complex I assembly, supported by a decreased NAD+/NADH ratio and morphometric changes in mitochondria.
Fig. 4 |. Valine tRNA biogenesis and bioavailability regulate mitochondrial complex I assembly.
a, Blue native (BN)-PAGE analysis (same gel). b, Oxygen consumption rate (OCR) of cells cultured in different levels of valine (FCCP, carbonyl cyanide-p-trifluoromethoxyphenylhydrazone) for 72 h. c, BN-PAGE (top), SDS–PAGE (bottom) and immunoblot analysis of CUTLL1 cells expressing doxycycline (dox)-inducible Cas13d and sgRNA 1 targeting the VARS transcript (same gel). CI to CV refer to complexes I to V, respectively. d, NAD+/NADH ratio in KOPTK1 cells cultured in different levels of valine for 72 h (left) or after inducible knockdown of VARS with three independent sgRNAs (right) (mean ± s.d. from technical replicates). Representative of n = 3 independent experiments. e, Representative electron micrographs of CUTLL1 cells cultured in different valine levels for 72 h (left). Quantification of the maximal width of cristae in 10 randomly selected mitochondria from 15 cells (right) (n = 110 cristae; mean ± s.d.; two-sided unpaired t-test).
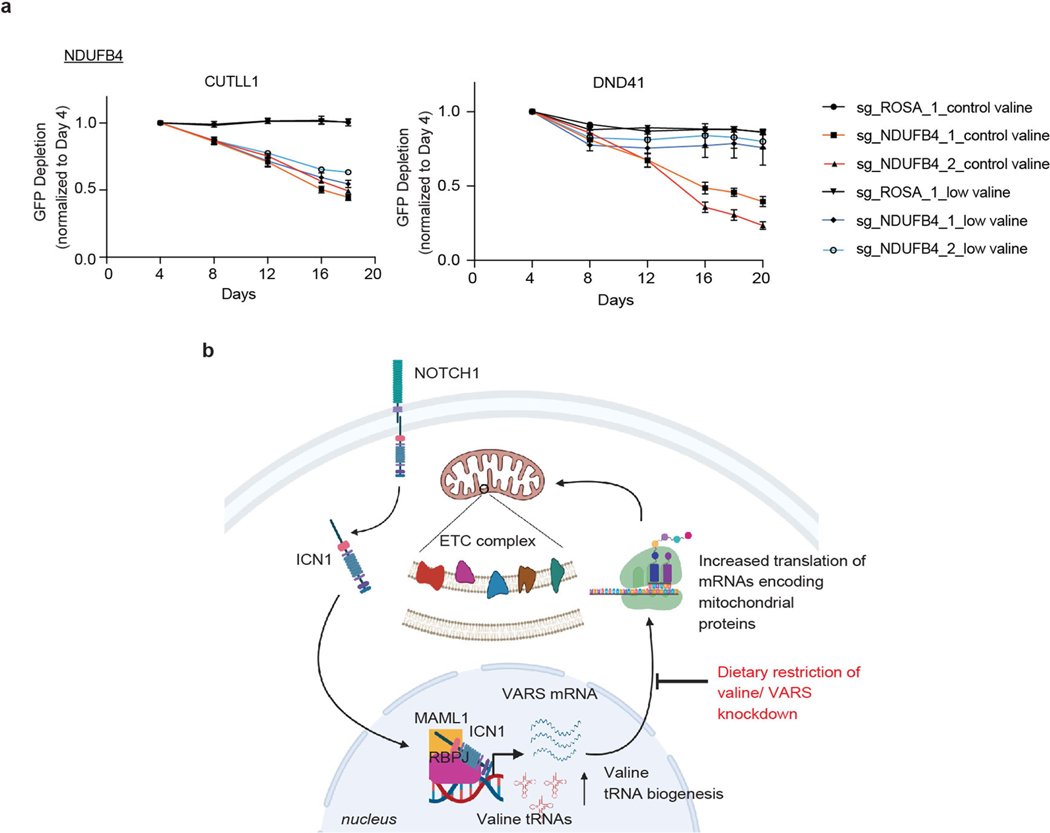
As further indication of defective complex I assembly and reduced NAD+ generation on valine restriction, we identified strong dependency in our genome-wide screen for nicotinamide phosphoribosyl-transferase (encoded by NAMPT), a rate-limiting enzyme in the NAD salvage pathway, in valine-restricted media, suggesting that alternate pathways are critical to regenerate NAD+ on valine limitation (Fig. 3b). In addition, loss of multiple genes encoding subunits of ETC complexes I, II and IV (NDUFA6, NDUFB4, NDUFS1, NDUFA11, SDHB, COX5B and COX10) promoted leukaemic cell growth in valine-restricted conditions (Fig. 3b, Extended Data Figs. 7b, 10a). These genes were recently identified as suppressors of complex I inhibition36, suggesting that mitochondrial dysfunction on valine restriction can be buffered by loss of pathway intrinsic genes.
In summary, we have identified a mechanism by which altered valine tRNA biogenesis can enhance mitochondrial bioenergetics by regulating the synthesis of ETC complex I proteins in human acute leukaemia. Tumour growth, metabolic adaptation and the microenvironment can affect the availability of specific amino acids for protein synthesis. Increased expression of ASNS and PYCR1, key enzymes in the cellular synthesis of asparagine and proline, respectively, were recently identified as adaptations to compensate for increased demand for these amino acids in protein synthesis in breast cancer models5,21. In line with these findings, our data show that upregulated valine tRNA biogenesis is an indicator of increased demand for valine in protein synthesis in T-ALL. In addition, a direct link for NOTCH1 signalling in upregulating valine tRNA biogenesis underscores a role for oncogenic transcriptional programs in coordinating tRNA supply with increased demands in protein production. Moreover, we show that this dependency can be targeted by restriction of dietary intake of valine in preclinical T-ALL mouse and human xenograft models. Mechanistically, restricting valine bioavailability in vivo reduced translational rates of mRNAs encoding mitochondrial ETC complex I subunits, resulting in reduced complex I formation and mitochondrial activity (Extended Data Fig. 10b). Consistent with our findings linking NOTCH1-induced translational reprogramming to ETC complex I assembly and cellular energy production, NOTCH1-activated T-ALL was previously shown to be sensitive to inhibitors of complex I37–39. Finally, a genome-wide loss-of-function CRISPR–Cas9 screen under different valine conditions identified targets for potential combination therapies with controlled dietary valine restriction that could enhance the potential of using dietary valine restriction as a therapeutic option. Notably, dietary manipulation of valine is used clinically in the management of metabolic diseases, such as propionic and methylmalonic acidaemias40–42, and may effectively synergize with targeted therapies in the treatment of human T-ALL.
Online content
Any methods, additional references, Nature Research reporting summaries, source data, extended data, Supplementary Information, acknowledgements, peer review information; details of author contributions and competing interests; and statements of data and code availability are available at https://doi.org/10.1038/s41586-021-04244-1.
Methods
Cell lines and cell culture
The human cell lines CUTLL1, Jurkat, DND41 and KOPTK1 were cultured in RPMI-1640 medium supplemented with 10% fetal bovine serum (FBS) and penicillin–streptomycin. Tissue culture reagents were purchased from Gibco. CUTLL1 Cas9-expressing cell lines were generated by transduction with retroviral Cas9–2A-blast (Addgene, plasmid #73310). Jurkat Cas9-expressing cell lines were generated by transduction with lentiviral MSCV-Cas9-puro (Addgene, plasmid #65655). The CUTLL1 Cas13d-expressing cell line was generated by transduction with lentiviral RfxCas13d (Addgene, plasmid #138149). All transfections were performed in HEK293T cells using polyethylenimine (PEI) reagent at 4:2:3 ratios of sgRNA or Cas9 or the Cas13d construct: pVSVG:pPax2 in OPTI-MEM solution. Viral supernatant was collected 36 h and 48 h post-transfection. Spin infections were performed at room temperature at 1,500g for 90 mins with polybrene reagent (1:2,000 dilution) (Fisher Scientific). The CUTLL1, KOPTK1, TAL1 and Jurkat cell lines were a gift from A. Ferrando’s laboratory at Columbia. HEK293T cells were purchased from ATCC CRL-1573. The cell lines were maintained in RPMI 1640 medium or Dulbecco’s modified Eagle’s medium (DMEM) (HEK293T) (Gibco), supplemented with 1 mM sodium pyruvate (Gibco). All media were supplemented with 10% FBS (Corning Life Sciences) and 1% penicillin–streptomycin/L-glutamine (Corning Life Sciences). All cell lines were maintained at 37 °C and 5% CO2 in a humidified atmosphere. HEK293T cells were authenticated by the supplier (ATCC Cell Line Authentication Service Sanger Sequencing). T-ALL cell lines were authenticated by PCR detection of originally described translocations, detection of intranuclear NOTCH1 and sensitivity to originally described drugs (γ-secretase inhibitor of NOTCH1 signalling). Cell lines were routinely monitored for mycoplasma contamination. All cells used in this study tested negative for mycoplasma contamination. The cell lines used in this study are not listed on the ICLAC list of commonly misidentified cell lines.
CRISPR tRNA library design
sgRNAs for 153 genes with known binding to tRNAs8 were extracted from the whole-genome human CRISPR–Cas9 library previously published43,44. A total of 1,522 sgRNA oligos targeting tRNA genes along with 3 negative controls were synthesized by Twist Bioscience (https://twistbioscience.com/) on a 12K array and amplified using array primers (Supplementary Table 1). Using a Gibson Assembly master mix (New England Biolabs), we cloned sgRNAs into a lentiviral sgRNA GFP-tagged vector (LRG) (Addgene plasmid no. 65656). Gibson reactions were transformed using DH10B electrocompetent cells (Invitrogen) at 2 kV, 200 Ω and 25 uF. Bacterial colonies were quantified to obtain approximately 70× coverage. All sgRNA sequences used in this study are provided in Supplementary Table 1.
CRISPR screen focused on tRNA pathway genes
CUTLL1 and Jurkat Cas9-expressing cells were transduced with a pooled sgRNA library consisting of 1,522 sgRNAs targeting individual genes involved in tRNA biogenesis at a low MOI (approximately 0.3). Spin infections were performed at room temperature at 1,500g for 90 min with polybrene reagent (1:2,000 dilution) (Fisher Scientific). On day 4 post-transduction, GFP percentage was assessed to determine infection efficiency and sgRNA coverage (approximately 300–500×). The remaining 300–500× cells were placed back into culture after each passage until 20 days post-transduction. Genomic DNA (gDNA) of cells containing 300–500× coverage were harvested on day 4 and day 20 using the Qiagen DNA kit based on the manufacturer’s protocol. For library construction, 200 ng of gDNA was amplified for 20 cycles using Phusion Master Mix. End repair products were generated using T4 DNA polymerase (NEB), DNA polymerase I (NEB) and T4 polynucleotide kinase (NEB). Subsequently, A-tail overhangs were added using Klenow DNA Pol Exo- (NEB). DNA fragments were then ligated with Illumina-compatible barcodes (Bioo Scientific) using T4 Quick Ligase (NEB) and amplified using pre-capture primers (five cycles). Barcoded libraries were then sequenced using Illumina HiSeq 2500.
tRNA-seq
tRNA-seq was performed using the DNA probes as previously described2. For tRNA profiling, cells were subjected to small RNA extraction (microRNA Purification Kit, Norgen) per the manufacturer’s guidelines. To deacylate the tRNA population, the samples were incubated in 100 mM Tris-HCl (pH 9.0) at 37 °C for 30 min and the reaction was stopped using an equal volume of acetate buffer (pH 4.8) and NaCl were added to the final concentration of 50 mM. The samples were then subjected to RNA precipitation at −20 °C overnight. Following resuspension, RNA samples were 3′ biotinylated in 25% DMSO using T4 RNA ligase (RNA 3′ End Biotinylation Kit, Thermo Scientific) at 16 °C overnight. The samples were then subjected to chloroform extraction and RNA precipitation. The RNA population was then divided into four batches and each batch was hybridized with one of the four pools of probe pairs in 10 mM Tris-HCl, 5 mM NaCl and 100 μM EGTA by incubating at 90 °C for 5 min followed by slow cool down to 55–60 °C (based on the melting temperature (Tm) of the pool). The hybridized samples were then subjected to ligation at 16 °C overnight (given the lower efficiency of T4 DNA ligase for DNA–RNA hybrids, overnight ligation is essential). MyOne-C1Streptavidin Dynabeads (Invitrogen) were then used to purify biotinylated DNA–RNA hybrids per the manufacturer’s instructions. Ligated probes were then eluted after incubation with RNase H and RNase A (30 min at 37 °C) followed by incubation with an elution buffer (50 mM Tris pH 8, 10 mM EDTA, 1% SDS; incubate at 65 °C for 30 min with intermittent vortexing). Following elution, the samples were purified with DNA Clean & Concentrator-5 (Zymo Research) per the manufacturer’s instructions and minimally amplified (12–15 cycles) with primers against the universal sequences included at the two ends of the ligated probes. This amplification step is required to add barcodes and linkers required for high-throughput Ilumina sequencing. The samples were then sequenced on NextSeq 500 Illumina sequencer (single-end; 85 cycles).
RNA-seq
RNA-seq libraries were prepared using NEXTflex Rapid Illumina Directional RNA-seq Library prep kit per the manufacturer’s guidelines. The libraries were sequenced in single-end by either HiSeq 2500 or HiSeq 4000 at 50 cycles. RNA-seq reads were aligned against the human reference genome (GRCh37/hg19) using the STAR aligner (version 2.5.0c)45 with default parameters, discarding all non-uniquely aligned reads. Duplicated reads were discarded using picard-tools. For read counting per gene, we used bamutils count of the ngsutils package (version 0.5.7)46 on gene annotations from Ensembl V75 in a stranded manner (options -uniq -multiple complete -library RF). Downstream processing was performed in R with the Bioconductor package edgeR (version 3.14.0)47 on stranded gene counts, normalizing for intra-sample and inter-sample variances (edgeR functions calcNormFactors and estimateTagwiseDisp), resulting in counts per million (CPM) per annotated gene. Differential expression analysis was performed per condition with the edgeR functions glmQLFit and glmQLFTest.
Ribosome profiling
Ribosome profiling was performed using Truseq Ribo Profile for mammalian cells (Illumina) per the manufacturer’s guidelines. NOTCH1-ΔEGFP+ cells (5–10 × 106) were sorted from the spleen of secondary-transplanted mice (biological duplicates for every dietary valine condition) per library preparation. The libraries were sequenced with Illumina HiSeq 2500 at 50 cycles in single-end mode.
Whole-genome CRISPR screen
Cas9-expressing CUTLL1 cells were transduced with the Brunello sgRNA library virus at a low MOI (approximately 0.3). On day 2 post-transduction, GFP+ percentage was assessed to determine infection efficiency and sgRNA coverage (approximately 1,000×). Then, puromycin (1 μg/ml) was added for 5 days to select infected (GFP+) cells. After selection, 100 × 106 infected cells were cultured in either complete (RPMI 20 mg/l valine) or valine-restricted medium (RPMI 2 mg/l valine). For each passage, 100 × 106 cells were placed back into culture. gDNA of cells containing approximately 1,000× coverage was harvested on days 4 and 7 after passage into different valine media using NucleoSpin Blood XL kits from Takara. For library construction, 300 μg of gDNA was amplified for 25 cycles (30 reactions) using EX-Taq (Takara) and primer pairs that contain barcodes. PCR products were size-selected using AMPure XP beads (Beckman Coulter). Barcoded libraries were then sequenced using Illumina NextSeq500 instrument (single end, 80 cycles).
sgRNA cloning
Individual sgRNAs for Cas9 targeting were cloned using the BsmBI restriction site into the LRG vector (Addgene, plasmid #65656). Individual sgRNAs compatible with Cas13d targeting were cloned into pLe ntiRNAGuide_001-hU6-RfxCas13d-DR1-BsmBI-EFS-GFP modified from pLentiRNAGuide_001-hU6-RfxCas13d-DR1-BsmBI-EFS-Puro (Addgene, plasmid #138150). All sgRNA sequences used in this study are listed in Supplementary Table 1.
CRISPR–Cas9 indel analysis
To quantify the spectrum of indel mutations induced by sgRNA targeting tRNA-Val-TAC, we transduced CUTLL1-Cas9 cells transduced either with sgROSA or sgVal-TAC, followed by cell sorting of GFP+/sgRNA+ populations at day 4 post-infection. Cells were then harvested for gDNA and PCR amplicon (ranging from 100 to 200 bp) were designed to flank the sgRNA recognition sequence. gDNA (200 ng) was amplified using 2× Phusion Master Mix and subjected to Sanger sequencing. Editing efficiency was computed using the ICE computational program from Synthego.
Western blotting
CUTLL1 and KOPTK1 cells treated with DMSO or γSI were pelleted and lysed using RIPA lysis and extraction buffer (Thermo Fisher, catalogue no. 89900). The lysates were boiled with Laemmli buffer, resolved by SDS–PAGE, transferred to PVDF membranes and proteins visualized by immunoblotting. VARS rabbit polyclonal antibody was purchased from Bethyl laboratories (catalogue no. A304–776A; dilution 1:1,000) and anti-actin antibody was purchased from Millipore (catalogue no. MAB1501R; dilution 1:3,000). ATF4 antibody was purchased from Protein Technologies (catalogue no. 60035–1; dilution 1:1,000). Uncropped and unprocessed scans are provided in Supplementary Fig. 1.
BN-PAGE
Cells (5 × 10⁵) were washed with PBS, resuspended in 400 μl of 4 mg/ml digitonin (Sigma) and protease inhibitor cocktail (PIC; Sigma) and incubated on ice for 10 min. Samples were washed twice with 1 ml cold PBS and centrifuged at 10,000g for 10 min at 4 °C. Pellets were resuspended in 1× NativePAGE Sample buffer (Invitrogen) containing 1% DDM (Invitrogen #BN2005) and PIC. After 5 min on ice, the lysates were spun at 22,000g for 30 min at 4 °C. G250 (10 μl; Invitrogen) was added to the supernatant and 25 μl of solubilized complexes were loaded onto a 3–12% native precast gel at 4 °C (Invitrogen). Gels were run in dark blue cathode running buffer (Invitrogen) for 30 min and subsequently in bright blue cathode running buffer (Invitrogen) for 75 min. For OXPHOS complex detection, the total OXPHOS Blue Native WB Antibody Cocktail (abcam, catalogue no. ab110412; dilution 1:2,000) and anti-NDUFS3 antibody (Genetex, catalogue no. GTX105835; dilution 1:1,000) were used. Uncropped and unprocessed scans are provided in Supplementary Fig. 1.
Quantitative real-time PCR
RNA was extracted using the RNeasy Mini Kit using Qiagen kit (catalogue no. 74106) following the manufacturer’s guidelines. cDNA was generated using the High Capacity RNA-to-cDNA kit from Life Technologies (catalogue no. 4387406) following the manufacturer’s guidelines. cDNA was used to perform quantitative PCR using Light cycler 480 SYBR green I Master Mix from Roche Diagnostics (catalogue no. 04887352001). The reactions were run in Roche Light cycler 480 II. All the primer sequences for quantitative PCR analysis are provided in Supplementary Table 1.
Mitochondrial respiration
We seeded 350,000 CUTLL1 and KOPTK1 cells per well in Cell Tak (Thermo Fisher Scientific)-coated XFe24 cell culture microplates, as indicated by the manufacturer. The experiment was performed in Cellular Assay Solution (RPMI 10–041-CV with 1 mM sodium pyruvate, pH 7.2). The assay consisted of oxygen consumption and extracellular acidification measurements during time starting with the basal conditions and followed by sequential injections of oligomycin 0.8 μM, FCCP 0.33 μM and rotenone/antimycin 0.5 μM. Three measurements were performed after each compound injection. The analysis was performed simultaneously in the same plate for the cells cultured in different valine media.
ROS measurements
Mitochondrial reactive oxygen species (ROS) were measured by Mito-SOX (Life Technologies). CUTLL1 and KOPTK1 cells cultured in different valine media for 72 h or CUTLL1 Cas13d cells transduced with sgRNAs targeting VARS or ROS were incubated in 5 μM MitoSOX reagent in HBSS for 10 min at 37 °C, light protected and then washed three times with HBSS. MitoSOX fluorescence was measured by FACS.
Transmission electron microscopy
Cultured cells were fixed in 0.1 M sodium cacodylate buffer (pH 7.4) containing 2.5% glutaraldehyde and 2% paraformaldehyde for 2 h and post-fixed with 1% osmium tetroxide and 1% potassium ferrocyanide for 1 h at 4 °C. Then block was stained in 0.25% aqueous uranyl acetate, processed in a standard manner and embedded in EMbed 812 (Electron Microscopy Sciences). Ultrathin 22 sections (60 nm) were cut, mounted on copper grids and stained with uranyl acetate and lead citrate. Stained grids were examined under a Philips CM-12 electron microscope and photographed with a Gatan (4k × 2.7k) digital camera. For morphometric analysis, maximal cristae width was measured using Image J (NIH) as shown in Extended Data Fig. 8g in at least 50 randomly selected mitochondria from a minimum of 15 cells per experiment.
Drug treatments and IC50 measurements
Cells were plated in 96-well plates and exposed to Venetoclax (ABT-199; Selleck no. S8048–1) or JPH-203 (Selleck no. S8667) with a minimum of three technical replicates per concentration per cell line. Cell viability was measured with the CellTiter-Blue reagent (Promega) according to manufacturer’s instructions. Absolute viability values were converted to percentage viability versus DMSO control treatment, and then nonlinear fit of log(inhibitor) versus response (three parameters) was performed in GraphPad Prism v7.0 to obtain the IC50 values.
Animals
All animal experiments were done in accordance with the approved protocols from the Institutional Animal Care and Use Committees (IACUSs), according to national and institutional guidelines. C57BL/6 male and female mice (8–10 weeks old) were purchased from Jackson Laboratory and bred in-house. NOD/SCID IL2Rgammanull (NSG) female and male mice (10 weeks old) were obtained from Jackson Laboratory and used for xenograft experiments. Mice were bred and maintained in individual ventilated cages and fed with autoclaved food and water at NYU School of Medicine Animal Facility. All mice were housed at 22 ± 1 ºC, 30–70% relative humidity, in a temperature-controlled ABSL-2 facility with 12 h day–night light cycles. Mice were cared for by the husbandry staff at NYULH DCM (division of comparative medicine), and diet and water were provided ad libitum. All animal experiments were performed in accordance with protocols approved by the NYULMC IACUC protocol IA16–00008. Transplanted mice that were age- and sex-matched were randomly assigned to groups and were fed different valine diets. End points for humane euthanasia were signs of pain or distress (hunched mice), acute anaemia (by monitoring the red blood cell/haematocrit count), signs of acute leukaemia (white blood cell greater than 40 K/μl), increased respiratory rate and/or effort (abdominal component), loss of ability to ambulate, dehydration and being moribund. These limits were not exceeded.
Details of NOTCH1 mutation in the PDX samples
PDX 1 has an insertion mutation (7326_7327 insTCCTAA) encoding a premature stop codon in the PEST domain. PDX 2 has an insertion mutation (7314_7315 insGATTGTCG) resulting in a frameshift predicted to result in partial or complete loss of the PEST domain.
Generation of NOTCH1-induced leukaemias
For analysis of leukaemia progression, c-kit+ haematopoietic stem and progenitor cells were enriched from bone marrow by magnetic selection (STEMCELL Technologies) using an antibody against CD117 (c-kit) and plated in retronectin-coated tissue culture plates in the presence of 50 ng/ml Flt3 ligand, 50 ng/ml SCF, 10 ng/ml IL-3 and 10 ng/ml IL-6. The cells were spin infected with concentrated retrovirus expressing NOTCH1-ΔE-IRESGFP+ or control vector. Transduction efficiency was determined by reporter fluorescence. 24 h post-transduction, GFP+ cells were sorted. For induction of T-ALL, irradiated mice (two rounds of 550 rads) received 2 × 10⁴ GFP+ cells, together with 2 × 10⁵ bone marrow mononuclear cells (wild type) for haemogenic support, via retro-orbital injection. The Mantel–Cox test was used for the analysis of survival data. No randomization or blinding method was used in these animal studies.
Flow cytometry analysis of haematopoietic populations
Single-cell suspensions of total bone marrow cells from 8–12-week-old wild-type mice fed different levels of dietary valine by crushing the leg bones and passing cells through a 40-μm filter. Single-cell suspensions of thymocytes were obtained by pressing the thymic lobe through a 40-μm filter. For flow cytometry-based analysis of bone marrow stem and progenitor populations, and discrete stages of T cell development, cells were stained with anti-mouse fluorochrome-conjugated antibodies as follows (clone names are provided in brackets). Thymus staining: CD45 A700 (dilution 1:300), lineage-negative (B220, CD11b, GR-1, Ter119) APC-Cy7 (dilution 1:300) each, CD25 FITC (dilution 1:200), CD4 PE (dilution 1:300), CD8 PE-Cy7 (dilution 1:200), CD44 PerCP-Cy5.5 (dilution 1:300) and DAPI (dilution 1:2,000). T cell immature subsets in the thymus: ETP (Lin−CD117hiCD44+), DN1 (Lin−CD44+CD25−), DN2 (Lin−CD44+CD25+), DN3 (Lin−CD44−CD25+) and DN4 (Lin−CD44−CD25−). Analysis was performed using a BD LSRII and a BD LSR Fortessa cell analyzer (BD Bioscience). For the LSK stains, single-cell suspension of bone marrow cells was stained with CD16/32 Biotin (dilution 1:100), Streptavidin A700 (dilution 1:400), CD117 APC (dilution 1:100), lineage-negative (CD3, B220, CD4, CD8, CD11b, GR-1, Ter119, NK1.1) APC-Cy7 (dilution 1:400) each, CD34 FITC (dilution 1:100), CD150 PE (dilution 1:100), Sca-1 PE-Cy7 (dilution 1:300), CD48 PerCP-Cy5.5 (dilution 1:100) and DAPI (dilution 1:2,000). All population analyses and quantification were performed using Flowjo version 10.6.1
tRNA aminoacylation assay
The tRNA aminoacylation assay was as previously performed48. Cells were treated as indicated, placed on ice, rinsed once with cold PBS and lysed with cold TRIzol (15596018, Life Technologies) on ice. Lysates were shaken with chloroform 5:1, centrifuged at 18,600g and precipitated with 2.7× volumes of cold ethanol in the presence of 30 μg of GlycoBlue Coprecipitant (AM9515, Thermo Fisher) overnight. Samples were resuspended in 0.3 M acetate buffer (pH 4.5) with 10 mM EDTA and precipitated again. Next day, samples were resuspended in 10 mM acetate buffer with 1 mM EDTA. Of each RNA sample, 2 μg was treated with 10 mM of either sodium periodate (‘oxidized sample’) or sodium chloride (‘non-oxidized sample’) and incubated for 20 min at room temperature in the dark. Sodium periodate was from Sigma-Aldrich (311448). Reactions were quenched with glucose for 15 min. Yeast tRNAPhe (R4018, Sigma-Aldrich) was added to each sample, after which samples were precipitated with ethanol. Samples were resuspended in 50 mM Tris buffer (pH 9) and incubated for 50 min at 37 °C, quenched with acetate buffer and precipitated. Finally, samples were resuspended in RNAse-free water and subjected to a ligation to a 5′-adenylated DNA adaptor (5′-/5rApp/TGGAATTCTCGGGTGCCAAGG/3ddC/−3′), using truncated KQ mutant T4 RNA ligase 2 (M0373, New England Biolabs), for 3 h at room temperature. Reverse transcription was performed with SuperScript IV reverse transcriptase (18090050, Thermo Scientific) according to the manufacturer’s instructions, with a primer complementary to the DNA adaptor. cDNA samples were subjected to quantitative PCR with tRNA isodecoder-specific primers designed so that the forward (FW) primer was complementary to the 5′ end of the tRNA, and the reverse (RV) primer spanned the junction between the 3′ end of the tRNA and the ligated adaptor. Primer sequences are included in Supplementary Table 1. The charged fraction value was calculated from a relative difference between a delta-Ct value from non-oxidized (representing total) and oxidized (representing charged) samples for each primer pair.
Reporter assays
We generated reporters expressing GFPd2 (approximately 2 h half-life) in fusion with either NDUFB1 or NDUFS5. CUTLL1 and Jurkat cell lines transduced with these reporter constructs were cultured in either complete medium or medium lacking valine or tryptophan for 8 h with or without cycloheximide (CHX). The geometric means of GFP fluorescence intensity were quantified and normalized to IRESmCherry (24 h half-life) as an internal control, and the value of CHX-treated cells was subtracted from respective samples to calculate the maximum effects of valine and tryptophan deprivation on GFPd2 fluorescence.
Bioinformatics
GRO-seq analysis.
GRO-seq data were downloaded from NCBI GEO accession GSE115894 using NCBI’s sra-toolkit version 2.9.1 and processed as described13. Sequencing reads were aligned against human reference genome GRCh37/hg19 using bowtie version 1.0.0 (ref.49). Only uniquely mapped reads were kept (MAPQ > 20) and removed by samtools version 1.3 (ref.50). Reads were counted in a stranded manner for all annotated genes downloaded from Ensembl Genes V75 using the bamutils count function from the ngsutils package46 version 0.5.7 (options -uniq -multiple complete -library RF). Further processing was performed with edgeR version 3.14.0 (ref. 47) with normalization of expression (functions calcNormFactors and estimateTagwiseDisp) leading to CPM per gene. Fold changes were calculated for each replicate individually against the average expression per gene of DMSO samples. Cluster analysis was performed by first computing dimensional reduction with a manifold approximation and projection (UMAP) in R using the umap package followed by k-means clustering with k = 8. Individual clusters were inspected for median expression behaviour of interest, with a strong expressional reduction upon γSI treatment and re-establishment of expression within 10 h post inhibitor wash off, and only clusters 2 and 3 were identified to follow this behaviour. For visualization, we created bigwig tracks per genomic strand using bedtools coverage (2.27.1) after normalizing for sequencing depth and fragment length of 250 bp (bedtools coverage option -fs 250). All tracks were visualized with IGV.
Ribo-seq analysis.
Ribo-seq data were analysed by first trimming adapter sequences using cutadapt (version 1.18)51, keeping reads longer than 15 bp (parameters -m 15 -q 25). Next, remaining trimmed reads were aligned against a non-coding RNA database downloaded from Ensembl Genes V85 with bowtie2 (version 2.3.4)49 to remove such reads from the read pool. All non-aligned reads, assuming those to be true coding-sequence matching reads, were then included in a second step aligned against the mouse reference genome sequence GRCm38/mm10 with STAR. Read counting was conducted with the STAR-integrated function ‘--quantMode GeneCounts’. Quality was measured by assessing read alignment within CDS (5′ bias alignment for RPF over total RNA) using the Picard-tools function CollectRnaSeqMetrics and the read length of successfully aligned CDS reads by custom scripts. Differential translation efficiency analysis was conducted with edgeR, after intra-sample and inter-sample normalization using functions ‘calcNormFactors’ and ‘estimateTagwiseDisp’. The differential analysis was performed with functions ‘glmFit’ and ‘glmLRT’ with a design matrix as follows: model.matrix (~condition+protocol+condition:proto col), where condition refers to different valine dilutions and protocol to either RPF or total RNA. Owing to high variability among primary mouse samples, we have not conducted multiple testing correction but assured significance by applying a higher P value cut-off of 0.01.
Codon enrichment analysis.
Codon enrichment analysis was performed by first downloading the coding sequences of all annotated genes for human (Ensembl Genes V75). Sequences were removed if they did not start with ATG or if the number of bases was not a multiple of three. Codons were then counted per each coding sequence and normalized by the total number of codons per sequence. The relative occurrences of valine codons (GTA, GTG and GTT) were summed for the representation plot.
RNA-seq analysis.
RNA-seq sequencing reads for both mouse and human datasets were processed similarly. First, all sequencing reads were aligned against either mouse or human reference sequences GRCm38/mm10 or GRCh37/hg19 for mouse and human datasets, respectively, using STAR aligner version 2.5.0c45 and discarding all non-uniquely mapped reads. Read counting per annotated gene on the exon level (Ensembl Genes V85 for mouse and Ensembl Genes V75 for human) was performed with the STAR integrated function ‘--quantMode GeneCounts’, and reverse-annotated (RF) counts were used for downstream analyses. Further analyses were conducted with edgeR version 3.14.0 (ref.47), using ‘calcNormFactors’ and ‘estimateTagwiseDisp’ functions for intra-sample and inter-sample normalization, and ‘glmQLFit’ and ‘glmQLFTest’ functions for differential analysis followed by multiple-testing correction (reporting the FDR per gene).
tRNA-seq analysis.
Sequencing data for tRNA genes were analysed similarly as described in2. First, unique sequence probes that are specific for tRNA genes were searched and counted within each individual read sequence. Next, raw counts of individual tRNA genes per sample were summed across all annotated genes for each tRNA anticodon, yielding a single count value per tRNA anticodon and sample. Next, raw counts were processed in edgeR version 3.14.0, using the functions ‘calcNormFactors’ and ‘estimateTagwiseDisp’ functions for intra-sample and inter-sample normalization. Differential analysis was further conducted with edgeR functions ‘glmQLFit’ and ‘glmQLFTest’, followed by multiple-testing correction reporting the FDR.
CRISPR analysis.
Sequencing data from CRISPR experiments were analysed similarly for whole-genome as well as tRNA-specific sgRNA libraries. First, adapter sequences were trimmed from all read sequences to extract the 20 bp sgRNA sequence for each read. Then, each sgRNA occurrence was counted by exact matches between trimmed reads and sgRNA sequences. Raw counts were normalized by the total of all read counts per sample (CPM normalization). For both, the whole-genome and tRNA-specific sgRNA libraries, negative control sgRNAs were used to individually normalize each sgRNA CPM with a z-score transformation based on mean and standard deviation solely of the negative control sgRNA CPMs. Then, delta z-scores between control samples and treatment samples were calculated. Last, to summarize the results on a per-gene level, we used the R package CERES52, to identify an essentiality score per gene rather than per sgRNA. CERES score calculation was executed with default parameters as described in the documentation using normalized delta z-scores from the respective pairwise comparisons described above.
Microarray analysis.
Microarray data was downloaded from GSE33469 and GSE33470. We downloaded preprocessed quantile-normalized data on the probe level. Next, we calculated gene-level expression by averaging across all probes per gene. Statistical evaluation was performed using an unpaired two-sided t-test followed by multiple testing correction reporting the FDR.
Experimental design
Experiments were not done in a blinded manner. Investigators were not blinded to animal experiments, as knowledge of treatment groups was required. However, multiple co-authors were involved in the assessment of the mouse experiments. Blinding was not performed on cell culture experiments, but relied on high-throughput 96-well assays to reduce bias.
Statistical analysis
Kaplan–Meier survival curve P values were calculated using log-rank Mantel–Cox test (two-sided). For statistical comparison, we performed either two-tailed unpaired Student’s t-test or two-way ANOVA followed up by either Tukey or Sidak multiple comparison analysis as recommended. All statistical analyses were performed in Prism (GraphPad) version 8 software. All in vitro cell line experiments were performed at least two independent times with most performed three independent times and further validated in two or more cell lines. The sample size for animal transplant experiments was determined on the basis of prior studies that yielded a two-tailed statistical test with ~80% power to detect a twofold change in tumour burden (a = 0.05). All attempts at replication were consistent for all animal and cell culture experiments. For all sequencing data types, successful replication was confirmed with principal component analysis.
Reporting summary
Further information on research design is available in the Nature Research Reporting Summary linked to this paper.
Data availability
All sequencing data created within this study were uploaded to the NCBI Gene Expression Omnibus (GEO) and is available under the accession codes: GSE165736; GSE165661 for RNA-seq; GSE165734 for tRNA-seq; GSE167534 for the CRISPR screen; and GSE167535 for Ribo-seq. Source data are provided with this paper.
Code availability
All custom codes written within this study can be found in the Supplementary Information
Extended Data
Extended Data Fig. 1 |. VARS mRNA expression is upregulated in primary T-ALL and is essential in T-ALL.
a, Gene Set Enrichment Analysis (GSEA) of genes involved in tRNA biogenesis in primary T-ALL compared to thymocytes and mature T cells subsets from healthy individuals. b, Screen validation of VARS using a competition-based proliferation assay in Cas9 expressing cell lines CUTLL1, Jurkat and DND41. Plotted are GFP percentages measured during 20 days in culture and normalized to day 4. Negative control sgRosa and three independent sgRNAs targeting VARS are shown in the graphs (n=3; mean ± SD of biological replicates). c, Box plot showing the expression of VARS mRNA in T-ALL patients (n=57 individuals) and thymocyte subsets (7 thymocyte and mature T-cell subsets derived from (n=3) independent donors) (quantile-normalized microarray results downloaded from GSE33469 and GSE33470). Boxes represent first and third quartiles and the line represent the median. Statistical evaluation between groups was performed using unpaired two-sided t-test followed by multiple testing correction (FDR) (Box plot values for CD34+CD1a−: min=6.93, max=6.99, q25%=6.94, q50%=6.96, q75%=6.97; for CD34+CD1a+: min=7.05, max=7.46, q25%=7.07, q50%=7.10, q75%=7.23; for CD4ISP: min=7.79, max=7.92, q25%=7.82, q50%=7.86, q75%=7.89; for DPCD3−: min=7.07, max=7.13, q25%=7.09, q50%=7.10, q75%=7.12; for DPCD3+: min=6.70, max=7.29, q25%=6.84, q50%=6.97, q75%=7.13; for CD3+CD4+: min=7.02, max=7.46, q25%=7.14, q50%=7.26, q75%=7.36; for CD3+CD8+: min=6.91, max=7.22, q25%=6.94, q50%=6.96, q75%=7.09; for T-ALL: min=8.98, max=11.28, q25%=10.29, q50%=10.47, q75%=10.63). d, Heatmap representation of changes in gene expression of all the amino acyl tRNA synthetases (RNA-seq) between primary T-ALL and naïve CD4 T cells. Heatmap shows log2 fold-change (FC) of FPKM of T-ALL against average CD4 T cells.
Extended Data Fig. 2 |. tRNA-Val-TAC expression is upregulated in primary T-ALL and is strongly essential for T-ALL survival.
a, Scatter plot showing the total expression of tRNAs in primary T-ALL samples (n=5 biological replicates) in the x-axis with differential expression of each tRNA species relative to mature CD4 T cell subset (n=2 biological replicates) in y-axis. b, Scatter plot showing the total expression of tRNAs in T-ALL cell lines (n=4 independent cell lines) in the x-axis with differential expression of each tRNA species relative to mature CD4 T cell subset (n=2 biological replicates) in y-axis. c, Schematic depicting the CRISPR Cas9 targeting of the anti-codon loop of tRNA-Val-TAC family genes. d, Sanger sequencing trace file of tRNA-Val-TAC genomic region in sgROSA and sgVal-TAC transduced CUTLL1 Cas9 cells. e, Size of indels along with their frequencies observed as quantified by the Synthego ICE program. f, Competition based proliferation assay in Cas9 expressing T-ALL cell lines CUTLL1, Jurkat and DND41. Plotted are GFP+ percentages measured during 16 days in culture and normalized to day 4. Negative control sgRosa and sgRNA targeting Val-TAC tRNA family are shown in the graphs (mean ± SD of n=3 independent experiments).
Extended Data Fig. 3 |. Oncogenic NOTCH1 signaling upregulates valine tRNA biogenesis.
a, GRO-Seq cluster analysis was performed by applying dimensional reduction with a manifold approximation and projection (UMAP) followed by k-means clustering with k=8. Clusters 2 (n = 2105 genes) and 3 (n = 2177 genes) are highlighted in orange and red respectively. b, Heatmap representation of mRNA expression changes measured by GRO-Seq within k-means clusters 2 and 3. The clusters define γSI responding genes with fast re-establishment of expression post inhibitor wash-off (see Extended Data Fig. 3a for median expression levels of all k-means clusters). Heatmap shows log2 FC of FPKM of individual GRO-Seq replicates against average DMSO signal of the respective genes. c, Snapshots of H3K4me3 ChIP-Seq on tRNA-Val-TAC 1–1 promoter and d, IL7R promoter as fold-enrichment over input. Below GRO-Seq in CUTLL1 cells upon DMSO, γSI treatment and release after drug washout as counts-per-million (cpm). e, Volcano plot showing differential expression of tRNA pathway genes (153 genes) in CUTLL1 (left) and KOPTK1 (right) upon treatment with DMSO or γSI for 72h. (n=2; FDR < 0.05 and log2FC > 0.58 or < −0.58), cytoplasmic aminoacyl tRNA synthetases are highlighted in green. Statistical evaluation was performed using two-sided edgeR analysis (function glmQLFTest) followed by multiple testing correction (FDR). f, Relative expression of VARS mRNA by qPCR analysis in human T-ALL cell line TAL1 following treatment with γSI for 72h. (mean ± SD of n=3 independent replicates, two-sided unpaired t-test). g, Volcano plot of differential expression of tRNA genes in CUTLL1 upon treatment with DMSO or γSI for 4 days. Valine tRNA genes are highlighted in green (n=2; FDR < 0.1 and log2FC > 0.58 or < −0.58). Statistical evaluation was performed using two-sided edgeR analysis (function glmQLFTest) followed by multiple testing correction (FDR). h, Val-tRNA and control Leu-tRNA aminoacylation analysis of CUTLL1 cells treated with either DMSO or γSI (mean ± SD of n=3 independent replicates, two-sided unpaired t-test).
Extended Data Fig. 4 |. Dietary valine deprivation/restriction reduce leukemic burden and increases survival in mice.
a, Kaplan-Meier curve representing morbidity of recipient mice transplanted with ckit+ cells transduced with either pMIG (n=8) or NOTCH1-ΔE-IRES-GFP (n=9) (Log-rank test, two-sided). b, Representative image of spleen from mice secondary transplanted with NOTCH-ΔE-GFP+ tumors and fed either control diet or valine-deficient diet for 3 weeks. c, Absolute leukemic burden in peripheral blood from mice fed either control diet or valine deficient diet for 3 weeks (mean ± SD of n=5 animals; two-sided unpaired t-test). d, Percentage annexin V positive cells (mean ± SD of n=3 animals; two-sided unpaired t-test). e, Absolute leukemic burden in peripheral blood from the mice transplanted with NOTCH-ΔE-GFP+ tumors and fed complete amino acid diet (n=7) or diets deficient in either valine (n=7), lysine (n=6) or asparagine (n=6); (mean ± SD of individual animals; two-sided unpaired t-test). f, Kaplan–Meier survival graph of mice represented in (e) (Log-rank test, two-sided). g, Representative image of spleen from mice fed different diets in (e) and (f). h, Peripheral tumor burden in mice fed valine deficient diet for 2 weeks at late stages of tumor development (n=10; two-sided unpaired t-test). i, Percentage GFP+ cells in peripheral blood of mice transplanted with (BCR-ABL-GFP+) tumors and fed either control diet or valine-deficient diet for 2 weeks (mean ± SD of n = 4 animals; two-sided unpaired t-test). j, Kaplan–Meier survival graph of NSG mice transplanted with patient derived xenograft T-ALL PDX_1 and fed either control diet (n=5) or valine deficient diet (n=5) (Log-rank test, two-sided). Death owing to leukemia or toxicity of valine deprivation is highlighted. k, Body weights of NSG mice transplanted with T-ALL PDX_1 and fed either control valine proficient diet or valine deficient diet (mean ± SD of n=5 animals; two-sided unpaired t-test). l, Schematic representation of secondary transplant experiment to test sensitivity of T-ALL to decreasing levels of dietary valine (created with Biorender.com). m, Body weights of C57BL/6 mice secondary transplanted with NOTCH-ΔE GFP+ tumors and fed either control valine proficient diet (n=5) or valine deficient diet (n=5) or valine deficient diet substituted with 0.8g/l valine (n=4) or 0.4g/l in drinking water (n=5) (mean ± SD of individual animals; two-sided unpaired t-test).
Extended Data Fig. 5 |. Dietary valine restriction does not affect hematopoiesis.
a, Body weight, White blood cell (WBC), red blood cell (RBC), lymphocyte, hemoglobin (Hgb) and Platelet counts in mice fed either control valine proficient diet (8g/Kg valine), valine deficient diet (0g/Kg valine) or valine deficient diet (0g/Kg valine) substituted with 0.8g/l valine in drinking water (mean ± SD of n=5 animals each condition; two-sided unpaired t-test) for 4 weeks. b, Total cell numbers of bone marrow (tibia+femur), spleen and thymus from mice fed either a control valine proficient diet (8g/Kg valine), valine deficient diet (0g/Kg valine) or valine deficient diet (0g/Kg valine) substituted with 0.8g/l valine in drinking water for 4 weeks (mean ± SD of n=4 animals each condition; two-sided unpaired t-test). c, Plasma valine levels in peripheral blood serum of mice fed either control valine proficient diet (8g/Kg valine), valine deficient diet (0g/Kg valine) or valine deficient diet (0g/Kg valine) substituted with 0.8g/l valine (mean ± SD of n=5 animals each condition; two-sided unpaired t-test).
Extended Data Fig. 6 |. Dietary valine restriction does not affect LSK and thymocytes.
a, Frequency of LSK and different progenitors (GMP, CMP and MEP) from mice fed either a complete valine proficient diet (8g/Kg valine), valine deficient diet (0g/Kg valine) or valine deficient (0g/Kg valine) diet substituted with 0.8g/l valine in drinking water (right) (mean ± SD of n=4 animals each condition; two-sided unpaired t-test). b, Representative flow cytometry plots of the different hematopoietic compartments highlighted in (a). c, Frequency of intra-thymic T-cell population represented as percentage of CD45+ cells from mice fed either a valine proficient diet (8g/Kg valine), valine deficient diet (0g/Kg valine) or valine deficient diet (0g/Kg valine) substituted with 0.8g/l valine in drinking water for 4 weeks (mean ± SD of n=4 animals each condition; Two-way Anova analysis with Tukey multiple test correction). d, Representative flow cytometry plots of the different thymocyte subsets from (c).
Extended Data Fig. 7 |. Genome-wide CRISPR maps positive and negative genetic interactions with valine restriction.
a, Val-tRNA and control Leu-tRNA aminoacylation analysis of CUTLL1 cells cultured in either standard valine media (20mg/l) or low valine media (2mg/l and 1mg/l) (mean ± SD of n=3 independent replicates, two-sided unpaired t-test). b, Gene ranks plotted based on Δ CERES dependency score between low valine media and standard valine media conditions for 4 days. The top negatively and positively selected genes in low valine media are highlighted in blue and red respectively. Genes involved in Branched chain amino acid metabolism are highlighted in green.c, Validation of SLC7A5 dependency and d, BCL2 in low valine media relative to standard valine media using a competition-based survival assay in Cas9 expressing T-ALL cell lines. Plotted are GFP percentages measured during 20 days in culture and normalized to day 4. Negative control sgRosa and two independent sgRNAs targeting SLC7A5 and BCL2 are shown in the graphs (mean ± SD of n=3 independent experiments). e, IC50 curve of SLC7A5 inhibitor JPH 203 and f, BCL2 inhibitor venetoclax of T-ALL cell lines in either standard valine and low valine media. Representative of (n=2 of independent experiments).
Extended Data Fig. 8 |. Valine restriction reduces translation of mitochondrial electron transport chain proteins.
a, Ribosome protected fragment (RPF) length distribution of the Ribo-Seq datasets (n=2 biological replicates each condition). b, Relative CDS distribution of the RPF fragments (n=2 biological replicates each condition). c, Percentage valine (left) and lysine (right) codons between mRNAs with lowest translational efficiency (TE; bottom 5%) and mRNAs with no significant changes in translational efficiency (log2FC > −0.1375 and < 0.1375) between leukemic cells isolated from mice fed control diet and valine restricted diet (n=2 biological replicates each condition) (Box plot values for valine: for genome 0.8g/l: min=1.42, max=13.73, q25%=4.99, q50%=5.99, q75%=7.09; for bottom 5% 0.8g/l: min=0.00, max=11.84, q25%=5.03, q50%=6.10, q75%=7.42; for genome 0.4g/l: min=0.00, max=17.07, q25%=5.04, q50%=6.09, q75%=7.20; for bottom 5% 0.4g/l: min=0.00, max=11.75, q25%=5.21, q50%=6.18, q75%=7.39; for genome 0g/l: min=0.00, max=15.79, q25%=5.02, q50%=6.9, q75%=7.19; for bottom 5% 0g/l: min=0.00, max=17.07, q25%=5.08, q50%=6.29, q75%=7.36) (Box plot values for lysine: for genome 0.8g/l: min=0.00, max=29.02, q25%=4.28, q50%=5.75, q75%=7.41; for bottom 5% 0.8g/l: min=0.00, max=14.85, q25%=3.77, q50%=5.36, q75%=7.14; for genome 0.4g/l: min=0.34, max=27.93, q25%=4.36, q50%=5.87, q75%=7.43; for bottom 5% 0.4g/l: min=0.47, max=14.85, q25%=3.92, q50%=5.45, q75%=7.11; for genome 0g/l: min=0.47, max=27.92, q25%=4.43, q50%=6.05, q75%=7.67; for bottom 5% 0g/l: min=0.00, max=15.76, q25%=3.63, q50%=5.26, q75%=6.96). d, Volcano plots of Δ translational efficiency in NOTCH-ΔE-GFP+ cells isolated from mice fed different levels of dietary valine (n=2 of biological replicates each condition). (p-value < 0.05 and log2FC > 0.58 or < −0.58). e, STRING Network Pathway enrichment analysis of the 162 mRNAs with reduced translational efficiencies in mice fed valine restricted diet relative to mice fed control valine proficient diet. f, Snapshot of Ribosome protected fragment (RPF) and total RNA tracks for gene Ndufs7 and g, Ndufs3. h, RPKM values of total RNA and RPF read counts for Ndufs3 and Ndufs7 (n=2 of biological replicates each condition). i, Schematic of the reporter constructs expressing GFPd2 in fusion with either NDUFB1 (high valine content) or NDUFS5 (low valine content). mCherry serves as an internal control. j, CUTLL1 and Jurkat cells infected with the reporter constructs were cultured in either complete RPMI media or media lacking either valine or tryptophan for 8h. Quantification of GFPd2 fluorescence normalized to mCherry signal and cycloheximide treatment are plotted. (mean ± SD of n=4 independent replicates; two-sided unpaired t-test.). k, Gene signatures upregulated in control diet (8g/Kg valine) is shown in red whereas gene signatures upregulated in mice fed reduced valine is highlighted in green. l, Immunoblots for ATF4 and actin (same gel) from NOTCH-ΔE-GFP+ cellular lysates isolated from mice fed different levels of dietary valine (n=2 biological replicates). For gel source data, see Supplementary Fig. 1. RPKM, reads per kilobase transcript per million mapped reads.
Extended Data Fig. 9 |. Valine tRNA biogenesis and bioavailability regulates levels of mitochondrial complex I.
a, Blue Native (BN)-PAGE analysis (same gel, for gel source data, see Supplementary Fig. 1) and b, maximal respiration of KOPTK1 cells cultured in different levels of valine for 72 h. c, Oxygen consumption rate (OCR) and d, Maximal respiration of CUTLL1 cells cultured in different levels of valine for 72 h (mean ± SD of n=5 independent replicates; two-sided unpaired t-test). e, Relative expression of VARS mRNA by qPCR analysis following 4 days of doxycycline treatment to induce Cas13d expression. (n=2 independent replicates). f, Competition based proliferation assay to validate loss of fitness following VARS knockdown in CUTLL1 Cas13d cells. Plotted are GFP percentages measured during 20 days in culture and normalized to day 0 of doxycycline treatment. Negative control sgRosa and three independent sgRNAs targeting VARS are shown in the graphs (mean ± SD of n=3 independent replicates). g, BN-PAGE (top) analysis of CUTLL1 cells expressing inducible Cas13d and sgRNA_1 targeting VARS transcript. SDS-PAGE and immunoblots confirming VARS knockdown (same gel, for gel source data, see Supplementary Fig. 1). h, NAD+/NADH ratio of CUTLL1 cells cultured in RPMI with different levels of valine for 72 h. Representative of (n=2) independent experiments. i, MitoSox staining of CUTLL1, KOPTK1 cells cultured in RPMI with different levels of valine for 72 h and analyzed by flow cytometry (left, middle). CUTLL1 Cas13d cells transduced with three independent sgRNAs targeting VARS transcript was treated with doxycycline to induce Cas13 expression. Day 8 of doxycycline treatment, cells were stained with MitoSOX and analyzed by flow cytometry (right). Graphs show Mito-SOX mean fluorescence intensity (MFI). Representative of (n=3) independent experiments (mean ± SD of n=4 technical replicates). j, Electron micrograph from CUTLL1 cells illustrating the mitochondrial cristae structure. Arrow denotes the parameter of maximal Cristae Lumen Width (CLW) quantified in this study. k, Representative electron micrographs of CUTLL1 cells cultured in RPMI with different levels of valine for 72 h. l, Representative electron micrographs of CUTLL1-Cas13d cells transduced with either sgROSA or sgRNA targeting VARS and doxycycline treated for 8 days to induce Cas13d expression (left). Quantification of maximal cristae width in 10 randomly selected mitochondria from 15 cells (right) (n=110 cristae; mean ± SD; two-sided unpaired t-test).
Extended Data Fig. 10 |. Loss of pathway intrinsic ETC proteins promotes resistance to valine restriction.
a, Validation of NDUFB4 as a positively selected gene in low valine media relative to standard valine media using a competition-based proliferation assay in Cas9 expressing cell lines CUTLL1 and DND41. Plotted are GFP percentages measured during 20 days in culture and normalized to day 4. Negative control sgRosa and two independent sgRNAs targeting NDUFB4 are shown in the graphs (mean ± SD of n=3 independent replicates). b, Schematic depicting how upregulated valine tRNA biogenesis regulates mitochondrial bio-energetics in T-ALL (created with Biorender.com).
Supplementary Material
Acknowledgements
We thank all members of the Aifantis laboratory for discussions throughout this project; S. Tavazoie (Rockefeller University) for sharing the tRNA-seq protocol along with the probe sequences; and N. Sanjana (NYU/NY Genome Center) for sharing the CRISPR–Cas13d tools. P.T. was supported by an AACR Incyte Corporation Leukemia Research Fellowship and by a Young Investigator Grant from Alex’s Lemonade Stand Cancer Research Foundation. M.T.W. is supported by the Leukemia & Lymphoma Society Career Development Program, American Society of Hematology Restart Award, and The Jeffrey Pride Foundation for Pediatric Cancer Research and the Children’s Oncology Group Foundation. C.G. is supported by the NIH/NCI 1K99CA252602–01 grant and is a Special Fellow of the Leukemia & Lymphoma Society. We thank NYU Langone Health Microscopy Laboratory for consultation and assistance with transmission electron microscopy (and light microscopy) work. This shared resource is partially supported by the Cancer Center support grant P30CA016087 at the Laura and Isaac Perlmutter Cancer Center. T.P. is supported by NIH grants (R37CA222504 and R01CA227649) and an American Cancer Society research scholar grant (RSG-17–200-01–TBE). A.T. is supported by the grants NC/NIH P01CA229086 and NCI/NIH R01CA252239. We thank the Genome Technology Center (GTC) for sequencing, and the Applied Bioinformatics Laboratories (ABL) for providing bioinformatics support. GTC and ABL are shared resources partially supported by the Cancer Center support grant P30CA016087 at the Laura and Isaac Perlmutter Cancer Center. This work used computing resources at the NYU School of Medicine High Performance Computing Facility. I.A. is supported by the NCI/NIH (1P01CA229086, 1R01CA228135, R01CA216421, R01CA242020, R01CA173636 and 1R01HL159175), the Alex’s Lemonade Stand Cancer Research Foundation, the St. Baldrick’s Foundation, the Leukemia and Lymphoma Society (TRP no. 6580–20), the Edward P Evans Foundation and the NYSTEM program of the New York State Health Department.
Footnotes
Competing interests I.A. is a consultant for Foresite Labs. A.T. is a scientific advisor to Intelligencia AI. T.P. has received honoraria and/or consulting fees from Calithera Biosciences, Vividion Therapeutics and research support from Bristol Myers Squibb, Dracen Pharmaceuticals and Agios Pharmaceuticals. All other authors declare no competing interests.
Additional information
Supplementary information The online version contains supplementary material available at https://doi.org/10.1038/s41586021-04244-1.
References
- 1.Rapino F. et al. Codon-specific translation reprogramming promotes resistance to targeted therapy. Nature 558, 605–609 (2018). [DOI] [PubMed] [Google Scholar]
- 2.Goodarzi H. et al. Modulated expression of specific tRNAs drives gene expression and cancer progression. Cell 165, 1416–1427 (2016). [DOI] [PMC free article] [PubMed] [Google Scholar]
- 3.Wolfe AL et al. RNA G-quadruplexes cause eIF4A-dependent oncogene translation in cancer. Nature 513, 65–70 (2014). [DOI] [PMC free article] [PubMed] [Google Scholar]
- 4.Truitt ML et al. Differential requirements for eIF4E dose in normal development and cancer. Cell 162, 59–71 (2015). [DOI] [PMC free article] [PubMed] [Google Scholar]
- 5.Loayza-Puch F. et al. Tumour-specific proline vulnerability uncovered by differential ribosome codon reading. Nature 530, 490–494 (2016). [DOI] [PubMed] [Google Scholar]
- 6.Cordo’ V., van der Zwet JCG, Canté-Barrett K, Pieters R & Meijerink JPP. T-cell acute lymphoblastic leukemia: a roadmap to targeted therapies. Blood Cancer Discov. 2, 19–31 (2021). [DOI] [PMC free article] [PubMed] [Google Scholar]
- 7.Van Vlierberghe P. et al. ETV6 mutations in early immature human T cell leukemias. J. Exp. Med. 208, 2571–2579 (2011). [DOI] [PMC free article] [PubMed] [Google Scholar]
- 8.Gerstberger S, Hafner M. & Tuschl T. A census of human RNA-binding proteins. Nat. Rev. Genet. 15, 829–845 (2014). [DOI] [PMC free article] [PubMed] [Google Scholar]
- 9.Gingold H. et al. A dual program for translation regulation in cellular proliferation and differentiation. Cell 158, 1281–1292 (2014). [DOI] [PubMed] [Google Scholar]
- 10.Aharon-Hefetz N. et al. Manipulation of the human tRNA pool reveals distinct tRNA sets that act in cellular proliferation or cell cycle arrest. eLife 9, e58461 (2020). [DOI] [PMC free article] [PubMed] [Google Scholar]
- 11.Weng AP et al. Activating mutations of NOTCH1 in human T cell acute lymphoblastic leukemia. Science 306, 269–271 (2004). [DOI] [PubMed] [Google Scholar]
- 12.Palomero T. et al. NOTCH1 directly regulates c-MYC and activates a feed-forward-loop transcriptional network promoting leukemic cell growth. Proc. Natl Acad. Sci. USA 103, 18261–18266 (2006). [DOI] [PMC free article] [PubMed] [Google Scholar]
- 13.Kloetgen A. et al. Three-dimensional chromatin landscapes in T cell acute lymphoblastic leukemia. Nat. Genet. 52, 388–400 (2020). [DOI] [PMC free article] [PubMed] [Google Scholar]
- 14.Weng AP et al. c-Myc is an important direct target of Notch1 in T-cell acute lymphoblastic leukemia/lymphoma. Genes Dev. 20, 2096–2109 (2006). [DOI] [PMC free article] [PubMed] [Google Scholar]
- 15.Medyouf H. et al. High-level IGF1R expression is required for leukemia-initiating cell activity in T-ALL and is supported by Notch signaling. J. Exp. Med. 208, 1809–1822 (2011). [DOI] [PMC free article] [PubMed] [Google Scholar]
- 16.González-García S. et al. CSL-MAML-dependent Notch1 signaling controls T lineage-specific IL-7Rα gene expression in early human thymopoiesis and leukemia. J. Exp. Med. 206, 779–791 (2009). [DOI] [PMC free article] [PubMed] [Google Scholar]
- 17.Harper AE, Miller RH & Block KP Branched-chain amino acid metabolism. Annu. Rev. Nutr. 4, 409–454 (1984). [DOI] [PubMed] [Google Scholar]
- 18.Aster JC et al. Oncogenic forms of NOTCH1 lacking either the primary binding site for RBP-Jκ or nuclear localization sequences retain the ability to associate with RBP-Jκ and activate transcription. J. Biol. Chem. 272, 11336–11343 (1997). [DOI] [PubMed] [Google Scholar]
- 19.King B. et al. The ubiquitin ligase FBXW7 modulates leukemia-initiating cell activity by regulating MYC stability. Cell 153, 1552–1566 (2013). [DOI] [PMC free article] [PubMed] [Google Scholar]
- 20.Kamata S. et al. Dietary deprivation of each essential amino acid induces differential systemic adaptive responses in mice. Mol. Nutr. Food Res. 58, 1309–1321 (2014). [DOI] [PubMed] [Google Scholar]
- 21.Knott SRV et al. Asparagine bioavailability governs metastasis in a model of breast cancer. Nature 554, 378–381 (2018). [DOI] [PMC free article] [PubMed] [Google Scholar]
- 22.Krall AS et al. Asparagine couples mitochondrial respiration to ATF4 activity and tumor growth. Cell Metab. 33, 1013–1026.e6 (2021). [DOI] [PMC free article] [PubMed] [Google Scholar]
- 23.Taya Y. et al. Depleting dietary valine permits nonmyeloablative mouse hematopoietic stem cell transplantation. Science 354, 1152–1155 (2016). [DOI] [PubMed] [Google Scholar]
- 24.D’Antona G. et al. Branched-chain amino acid supplementation promotes survival and supports cardiac and skeletal muscle mitochondrial biogenesis in middle-aged mice. Cell Metab. 12, 362–372 (2010). [DOI] [PubMed] [Google Scholar]
- 25.Cummings NE et al. Restoration of metabolic health by decreased consumption of branched-chain amino acids. J. Physiol. 596, 623–645 (2018). [DOI] [PMC free article] [PubMed] [Google Scholar]
- 26.Solon-Biet SM et al. Branched chain amino acids impact health and lifespan indirectly via amino acid balance and appetite control. Nat. Metab. 1, 532–545 (2019). [DOI] [PMC free article] [PubMed] [Google Scholar]
- 27.Wang W. & Zou W. Amino acids and their transporters in T cell immunity and cancer therapy. Mol. Cell 80, 384–395 (2020). [DOI] [PMC free article] [PubMed] [Google Scholar]
- 28.White PJ et al. The BCKDH kinase and phosphatase integrate BCAA and lipid metabolism via regulation of ATP-citrate lyase. Cell Metab. 27, 1281–1293.e7 (2018). [DOI] [PMC free article] [PubMed] [Google Scholar]
- 29.Altman BJ, Stine ZE & Dang CV From Krebs to clinic: glutamine metabolism to cancer therapy. Nat. Rev. Cancer 16, 619–634 (2016). [DOI] [PMC free article] [PubMed] [Google Scholar]
- 30.Nicklin P. et al. Bidirectional transport of amino acids regulates mTOR and autophagy.Cell 136, 521–534 (2009). [DOI] [PMC free article] [PubMed] [Google Scholar]
- 31.Rosilio C. et al. L-type amino-acid transporter 1 (LAT1): a therapeutic target supporting growth and survival of T-cell lymphoblastic lymphoma/T-cell acute lymphoblastic leukemia. Leukemia 29, 1253–1266 (2015). [DOI] [PubMed] [Google Scholar]
- 32.Wempe MF et al. Metabolism and pharmacokinetic studies of JPH203, an L-amino acid transporter 1 (LAT1) selective compound. Drug Metab. Pharmacokinet. 27, 155–161 (2012). [DOI] [PubMed] [Google Scholar]
- 33.Souers AJ et al. ABT-199, a potent and selective BCL-2 inhibitor, achieves antitumor activity while sparing platelets. Nat. Med. 19, 202–208 (2013). [DOI] [PubMed] [Google Scholar]
- 34.Costa-Mattioli M. & Walter P. The integrated stress response: from mechanism to disease. Science 368, eaat5314 (2020). [DOI] [PMC free article] [PubMed] [Google Scholar]
- 35.Giacomello M, Pyakurel A, Glytsou C. & Scorrano L. The cell biology of mitochondrial membrane dynamics. Nat. Rev. Mol. Cell Biol. 21, 204–224 (2020). [DOI] [PubMed] [Google Scholar]
- 36.To TL et al. A compendium of genetic modifiers of mitochondrial dysfunction reveals intra-organelle buffering. Cell 179, 1222–1238.e17 (2019). [DOI] [PMC free article] [PubMed] [Google Scholar]
- 37.Herranz D. et al. Metabolic reprogramming induces resistance to anti-NOTCH1 therapies in T cell acute lymphoblastic leukemia. Nat. Med. 21, 1182–1189 (2015). [DOI] [PMC free article] [PubMed] [Google Scholar]
- 38.Kishton RJ et al. AMPK is essential to balance glycolysis and mitochondrial metabolism to control T-ALL cell stress and survival. Cell Metab. 23, 649–662 (2016). [DOI] [PMC free article] [PubMed] [Google Scholar]
- 39.Garcia-Bermudez J. et al. Aspartate is a limiting metabolite for cancer cell proliferation under hypoxia and in tumours. Nat. Cell Biol. 20, 775–781 (2018). [DOI] [PMC free article] [PubMed] [Google Scholar]
- 40.Manoli I. & Venditti CP Disorders of branched chain amino acid metabolism. Transl. Sci. Rare Dis. 1, 91–110 (2016). [DOI] [PMC free article] [PubMed] [Google Scholar]
- 41.Haijes HA, van Hasselt PM, Jans JJM & Verhoeven-Duif NM Pathophysiology of propionic and methylmalonic acidemias. Part 2: treatment strategies. J. Inherit. Metab. Dis. 42, 745–761 (2019). [DOI] [PubMed] [Google Scholar]
- 42.Sivanand S. & Vander Heiden MG Emerging roles for branched-chain amino acid metabolism in cancer. Cancer Cell 37, 147–156 (2020). [DOI] [PMC free article] [PubMed] [Google Scholar]
- 43.Wang T, Wei JJ, Sabatini DM & Lander ES Genetic screens in human cells using the CRISPR–Cas9 system. Science 343, 80–84 (2014). [DOI] [PMC free article] [PubMed] [Google Scholar]
- 44.Doench JG et al. Optimized sgRNA design to maximize activity and minimize off-target effects of CRISPR–Cas9. Nat. Biotechnol. 34, 184–191 (2016). [DOI] [PMC free article] [PubMed] [Google Scholar]
- 45.Dobin A. et al. STAR: ultrafast universal RNA-seq aligner. Bioinformatics 29, 15–21 (2013). [DOI] [PMC free article] [PubMed] [Google Scholar]
- 46.Breese MR & Liu Y. NGSUtils: a software suite for analyzing and manipulating next-generation sequencing datasets. Bioinformatics 29, 494–496 (2013). [DOI] [PMC free article] [PubMed] [Google Scholar]
- 47.Robinson MD, McCarthy DJ & Smyth GK edgeR: a Bioconductor package for differential expression analysis of digital gene expression data. Bioinformatics 26, 139–140 (2010). [DOI] [PMC free article] [PubMed] [Google Scholar]
- 48.Pavlova NN et al. Translation in amino-acid-poor environments is limited by tRNAGln charging. eLife 9, e62307 (2020). [DOI] [PMC free article] [PubMed] [Google Scholar]
- 49.Langmead B. & Salzberg SL Fast gapped-read alignment with Bowtie 2. Nat. Methods 9, 357–359 (2012). [DOI] [PMC free article] [PubMed] [Google Scholar]
- 50.Li H. et al. The Sequence Alignment/Map format and SAMtools. Bioinformatics 25, 2078–2079 (2009). [DOI] [PMC free article] [PubMed] [Google Scholar]
- 51.Martin M. Cutadapt removes adapter sequences from high-throughput sequencing reads. EMBnet.journal 17, 10–12 (2011). [Google Scholar]
- 52.Meyers RM et al. Computational correction of copy number effect improves specificity of CRISPR–Cas9 essentiality screens in cancer cells. Nat. Genet. 49, 1779–1784 (2017). [DOI] [PMC free article] [PubMed] [Google Scholar]
Associated Data
This section collects any data citations, data availability statements, or supplementary materials included in this article.
Supplementary Materials
Data Availability Statement
All sequencing data created within this study were uploaded to the NCBI Gene Expression Omnibus (GEO) and is available under the accession codes: GSE165736; GSE165661 for RNA-seq; GSE165734 for tRNA-seq; GSE167534 for the CRISPR screen; and GSE167535 for Ribo-seq. Source data are provided with this paper.


