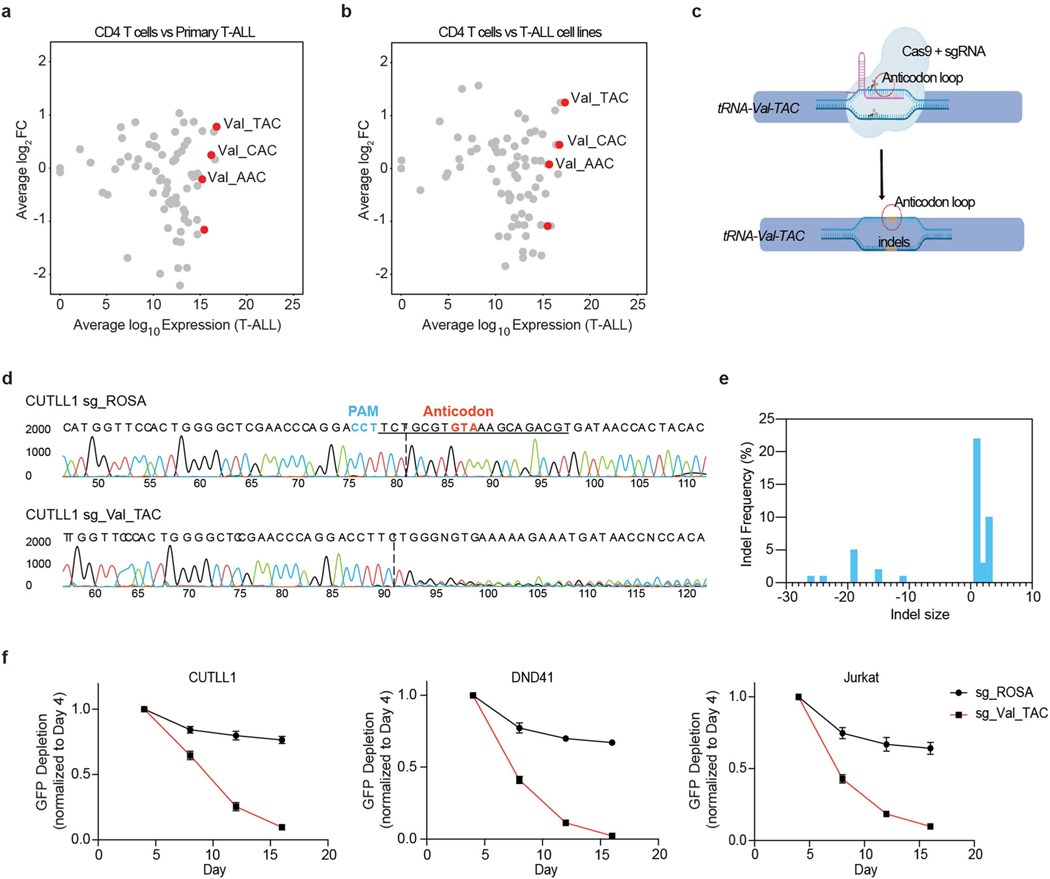
Extended Data Fig. 2 |. tRNA-Val-TAC expression is upregulated in primary T-ALL and is strongly essential for T-ALL survival.
a, Scatter plot showing the total expression of tRNAs in primary T-ALL samples (n=5 biological replicates) in the x-axis with differential expression of each tRNA species relative to mature CD4 T cell subset (n=2 biological replicates) in y-axis. b, Scatter plot showing the total expression of tRNAs in T-ALL cell lines (n=4 independent cell lines) in the x-axis with differential expression of each tRNA species relative to mature CD4 T cell subset (n=2 biological replicates) in y-axis. c, Schematic depicting the CRISPR Cas9 targeting of the anti-codon loop of tRNA-Val-TAC family genes. d, Sanger sequencing trace file of tRNA-Val-TAC genomic region in sgROSA and sgVal-TAC transduced CUTLL1 Cas9 cells. e, Size of indels along with their frequencies observed as quantified by the Synthego ICE program. f, Competition based proliferation assay in Cas9 expressing T-ALL cell lines CUTLL1, Jurkat and DND41. Plotted are GFP+ percentages measured during 16 days in culture and normalized to day 4. Negative control sgRosa and sgRNA targeting Val-TAC tRNA family are shown in the graphs (mean ± SD of n=3 independent experiments).

