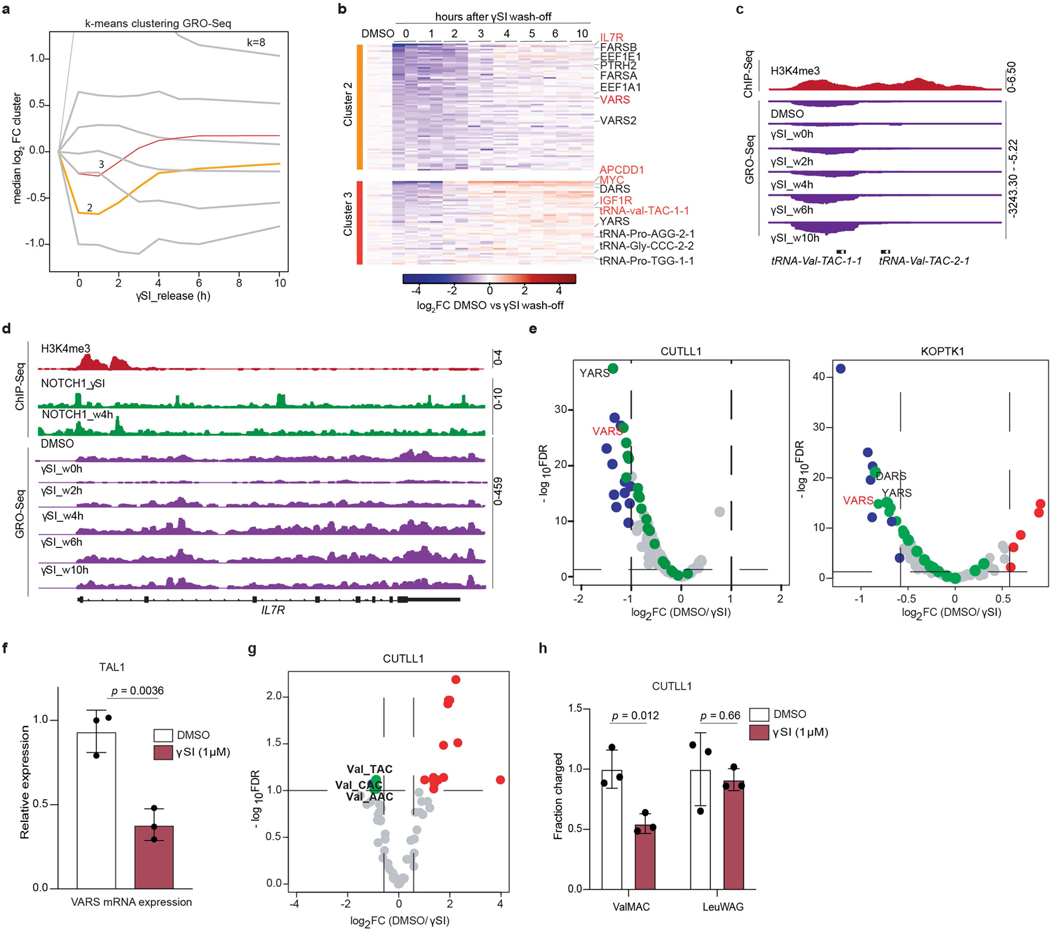
Extended Data Fig. 3 |. Oncogenic NOTCH1 signaling upregulates valine tRNA biogenesis.
a, GRO-Seq cluster analysis was performed by applying dimensional reduction with a manifold approximation and projection (UMAP) followed by k-means clustering with k=8. Clusters 2 (n = 2105 genes) and 3 (n = 2177 genes) are highlighted in orange and red respectively. b, Heatmap representation of mRNA expression changes measured by GRO-Seq within k-means clusters 2 and 3. The clusters define γSI responding genes with fast re-establishment of expression post inhibitor wash-off (see Extended Data Fig. 3a for median expression levels of all k-means clusters). Heatmap shows log2 FC of FPKM of individual GRO-Seq replicates against average DMSO signal of the respective genes. c, Snapshots of H3K4me3 ChIP-Seq on tRNA-Val-TAC 1–1 promoter and d, IL7R promoter as fold-enrichment over input. Below GRO-Seq in CUTLL1 cells upon DMSO, γSI treatment and release after drug washout as counts-per-million (cpm). e, Volcano plot showing differential expression of tRNA pathway genes (153 genes) in CUTLL1 (left) and KOPTK1 (right) upon treatment with DMSO or γSI for 72h. (n=2; FDR < 0.05 and log2FC > 0.58 or < −0.58), cytoplasmic aminoacyl tRNA synthetases are highlighted in green. Statistical evaluation was performed using two-sided edgeR analysis (function glmQLFTest) followed by multiple testing correction (FDR). f, Relative expression of VARS mRNA by qPCR analysis in human T-ALL cell line TAL1 following treatment with γSI for 72h. (mean ± SD of n=3 independent replicates, two-sided unpaired t-test). g, Volcano plot of differential expression of tRNA genes in CUTLL1 upon treatment with DMSO or γSI for 4 days. Valine tRNA genes are highlighted in green (n=2; FDR < 0.1 and log2FC > 0.58 or < −0.58). Statistical evaluation was performed using two-sided edgeR analysis (function glmQLFTest) followed by multiple testing correction (FDR). h, Val-tRNA and control Leu-tRNA aminoacylation analysis of CUTLL1 cells treated with either DMSO or γSI (mean ± SD of n=3 independent replicates, two-sided unpaired t-test).

