Figure 3.

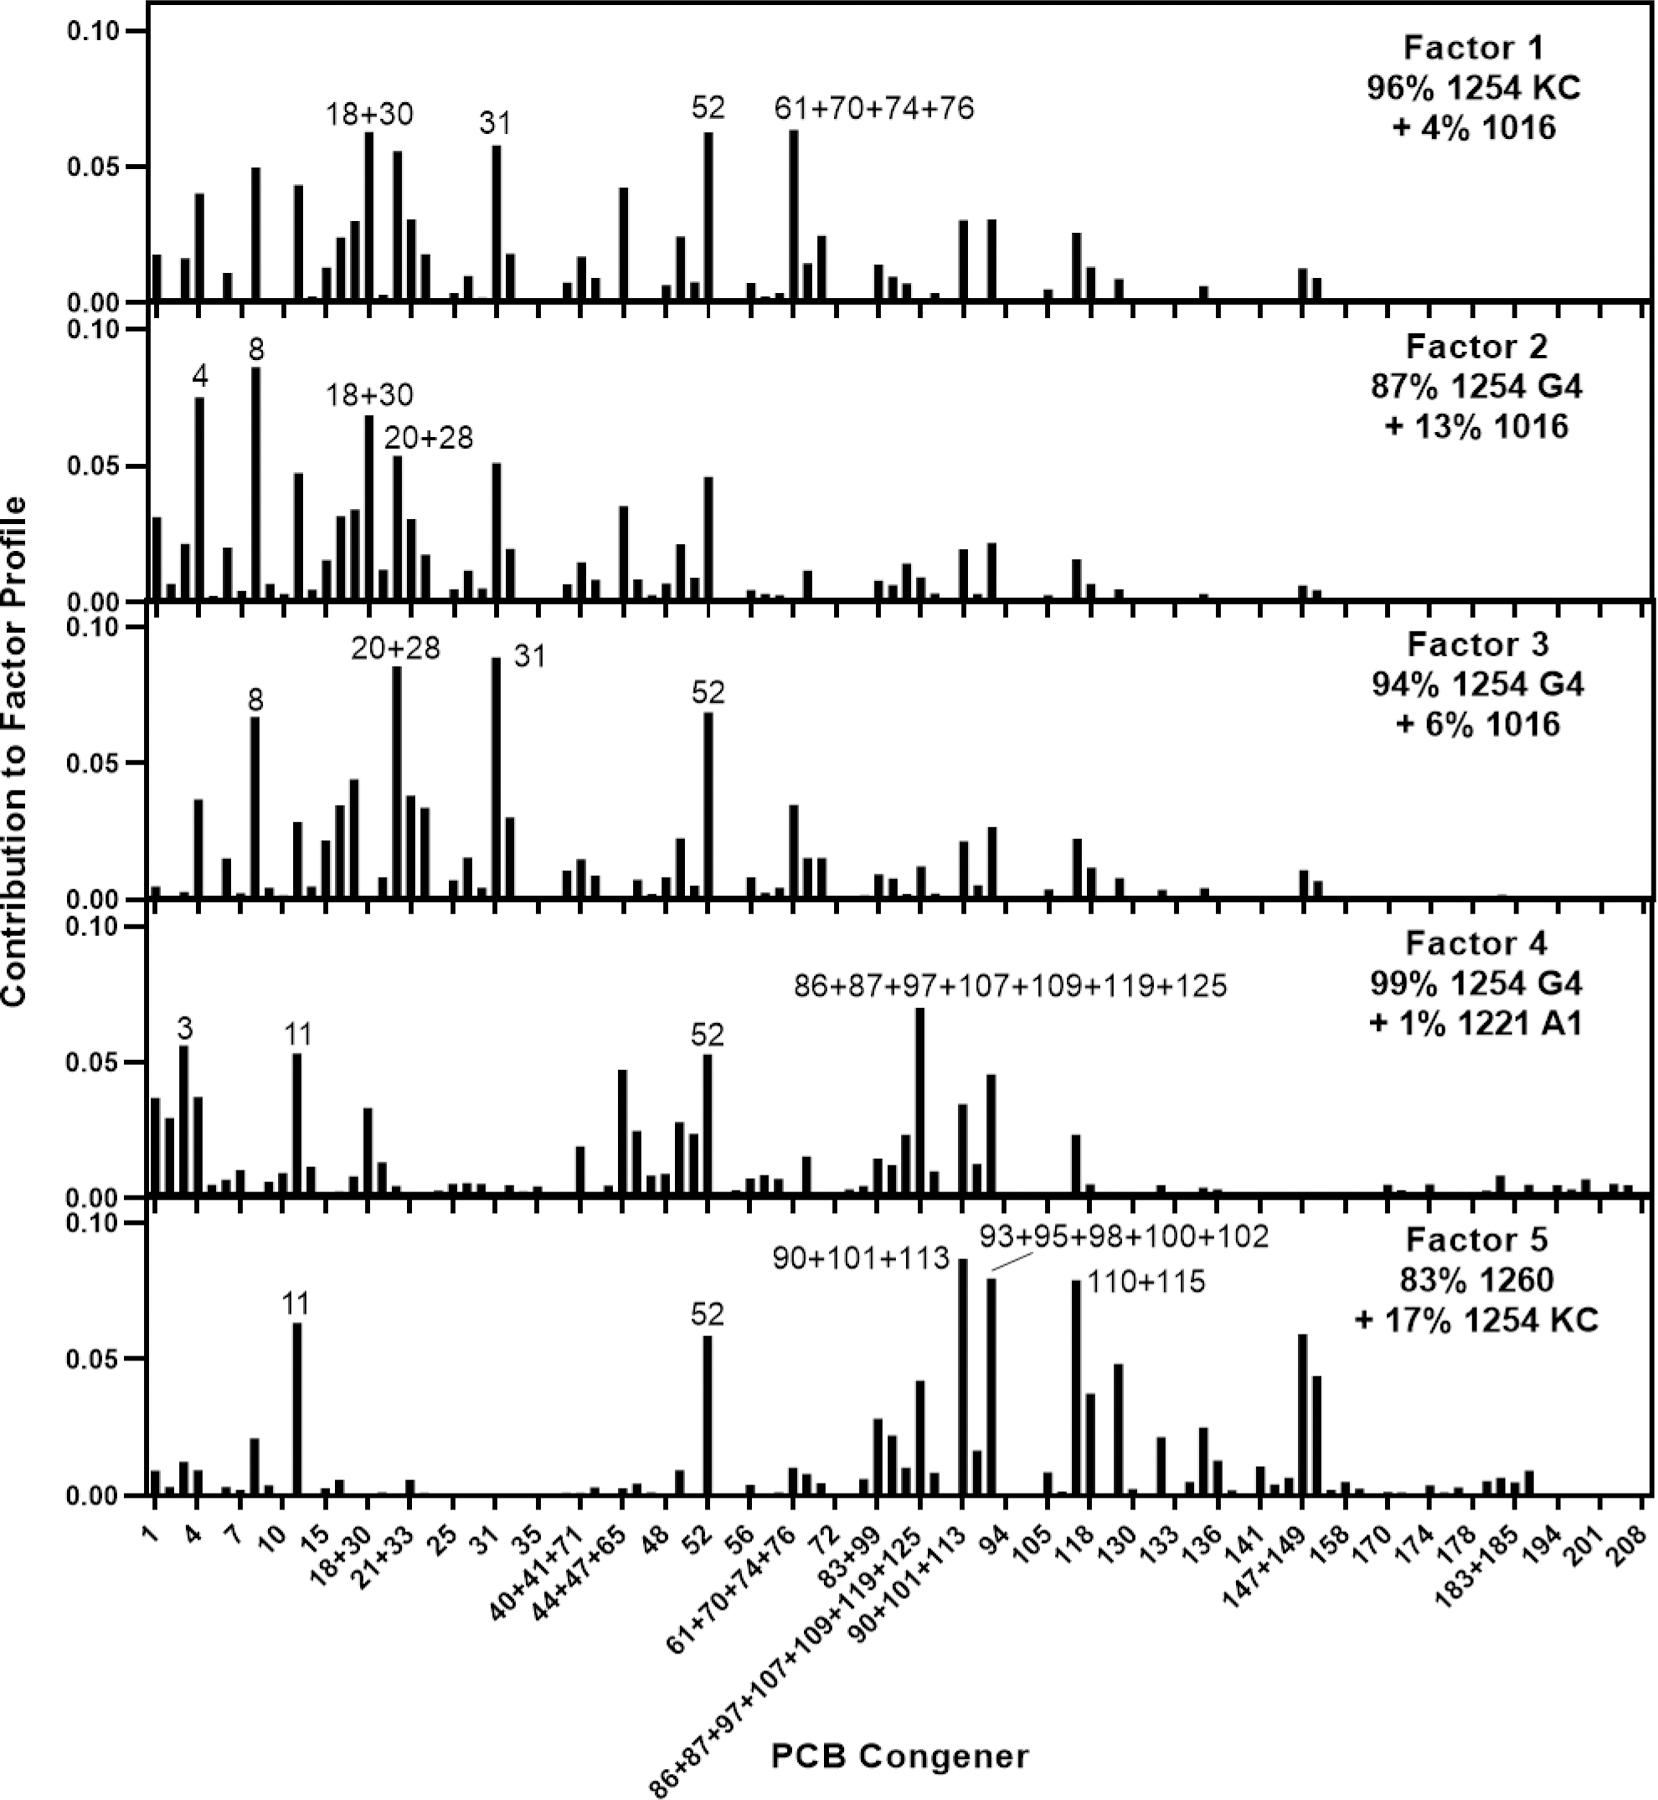
PCB profiles of the 5 PUF-PAS factors that describe Chicago air from 2011 to 2013. Included are the Aroclor mixtures that best match the factor profiles. The congeners are ordered on the x-axis as listed in Table S5.

PCB profiles of the 5 PUF-PAS factors that describe Chicago air from 2011 to 2013. Included are the Aroclor mixtures that best match the factor profiles. The congeners are ordered on the x-axis as listed in Table S5.