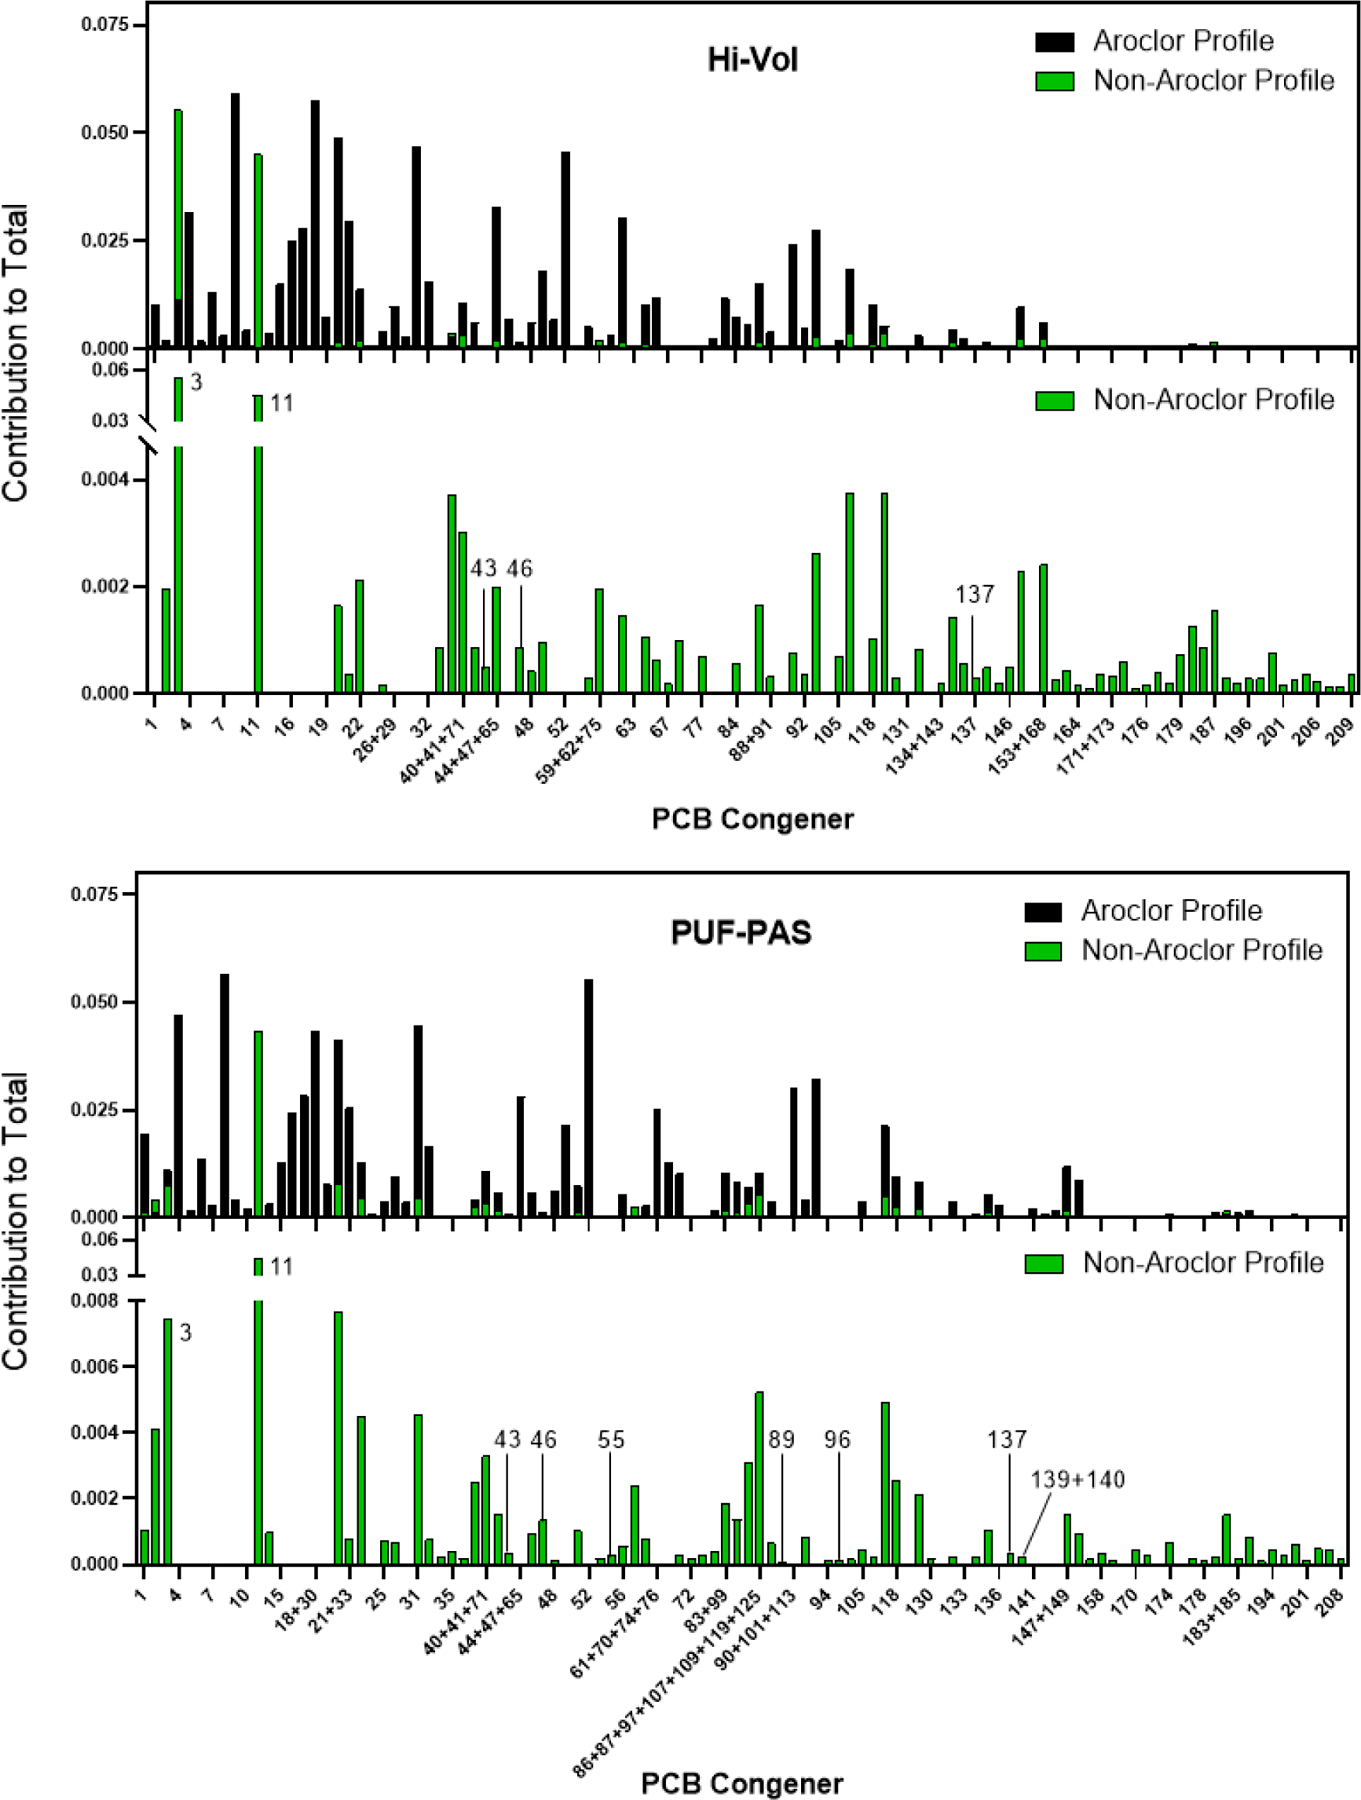
Figure 7.

Profiles of Aroclor (black) and non-Aroclor sources (green) that are measured in Chicago air using Hi-Vols (top pair) or PUF-PAS (bottom pair). The bottom plot of each pair includes only the non-Aroclor mixture. The congeners are ordered on the x-axis as listed in Table S4 for the top pair and Table S5 for the bottom pair. Labeled congeners are discussed in the text.
